The Year over Year Performance Pane in the Marketing Module enables marketers to directly compare key performance indicators (KPIs) such as impressions, clicks, conversions, and spend across multiple years. This pane helps identify growth trends, detect performance declines, and align budget decisions with historical outcomes. By visualizing annual comparisons side by side, it empowers teams to understand whether campaigns are becoming more efficient and effective over time.
Tip: Focus on year-over-year growth rates, not just totals, to capture efficiency gains or warning signs.
Use this pane as an early diagnostic tool before committing additional budget allocations.
Key Moments to Look Out For
-
Immediate visibility into whether campaigns are scaling effectively or stagnating.
-
Spotting anomalies, such as a spike in impressions but flat conversions, which may indicate inefficiency.
-
Year-over-year breakdowns allow for strategic planning around seasonality and recurring events.
-
Color-coded and segmented visuals make growth vs. contraction easy to interpret.
-
Hover tooltips provide exact values, helping validate trends at a granular level.
Exploring Features
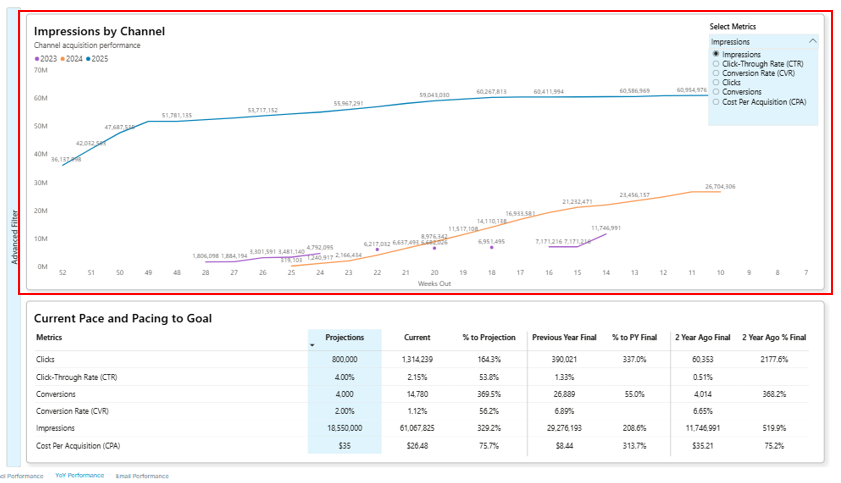
Week-over-Week KPI Trends Across Years
This chart allows comparison of different KPIs (Impressions, CTR, CVR, Clicks, Conversions, CPA) on a week-over-week basis across multiple years, helping marketers evaluate performance trends over time.
-
Provides flexibility to toggle between KPIs using the dropdown (Impressions, CTR, CVR, Clicks, Conversions, CPA).
-
Visualizes weekly pacing for each selected KPI across historical years.
-
Highlights seasonality patterns by showing peaks and dips across comparable weeks.
-
Helps identify consistent trends, anomalies, or performance gaps week by week.
-
Enables marketers to compare KPI performance efficiency year-over-year at the same campaign stage.
-
Acts as a diagnostic tool to understand whether improvements are structural (year-over-year) or temporary (week-specific).
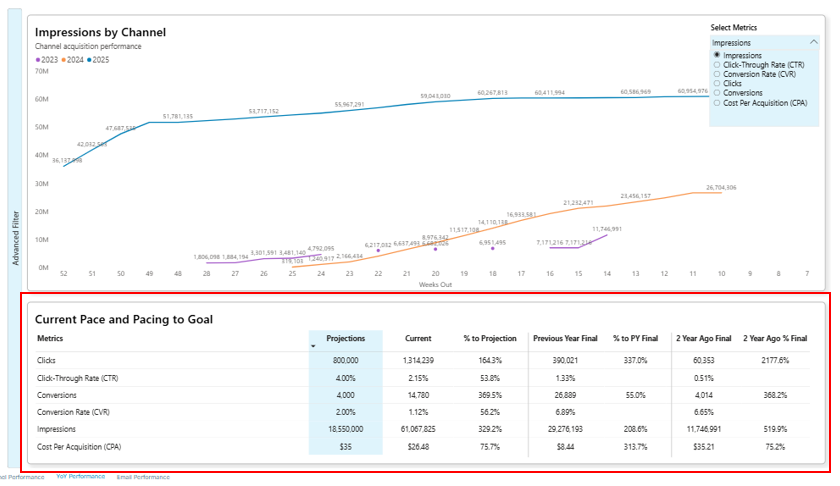
Current Pace and Pacing to Goal
This table provides a detailed comparison of current KPI performance against projections, prior year results, and two-year historical benchmarks, helping track progress and efficiency.
-
Displays side-by-side projections vs. actual current performance for each KPI (Clicks, CTR, Conversions, CVR, Impressions, CPA).
-
Shows percentage achievement toward current year projections, offering a quick gauge of pacing progress.
-
Compares results to the previous year’s final performance, highlighting growth or decline trends.
-
Includes two-year ago benchmarks, revealing longer-term performance trajectory.
-
Surfaces over- or under-performance patterns across KPIs, helping prioritize corrective actions.
-
Supports leadership reporting by quantifying current campaign strength in both short- and long-term context.