US Audience Pane
The US Audience pane in Bear IQ provides a comprehensive overview of the live state performance of your current event registrants. This feature enables you to track the total number of US registrations, understand their makeup within your total audience, and compare these metrics to previous events. By using this pane, you can assess which states are overperforming or underperforming in terms of registration, providing valuable insights for event planning and analysis.
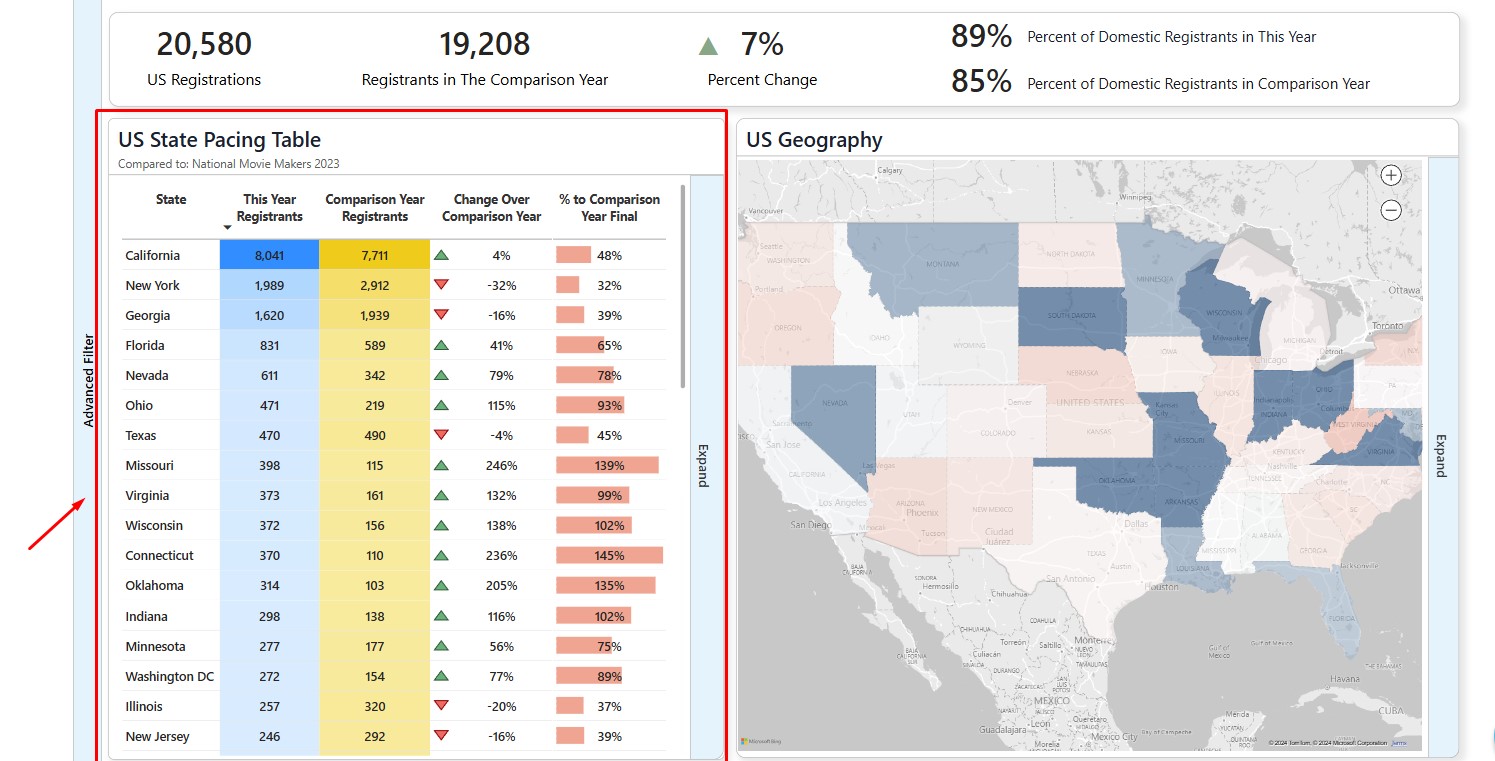
Tip: Quickly sort the table by change over the comparison year to instantly identify overperforming and underperforming states.
Key Moments to Look Out for:
Viewing total US registrations and their audience percentage
Comparing current registration metrics with past events
Sorting state performance by change over comparison year
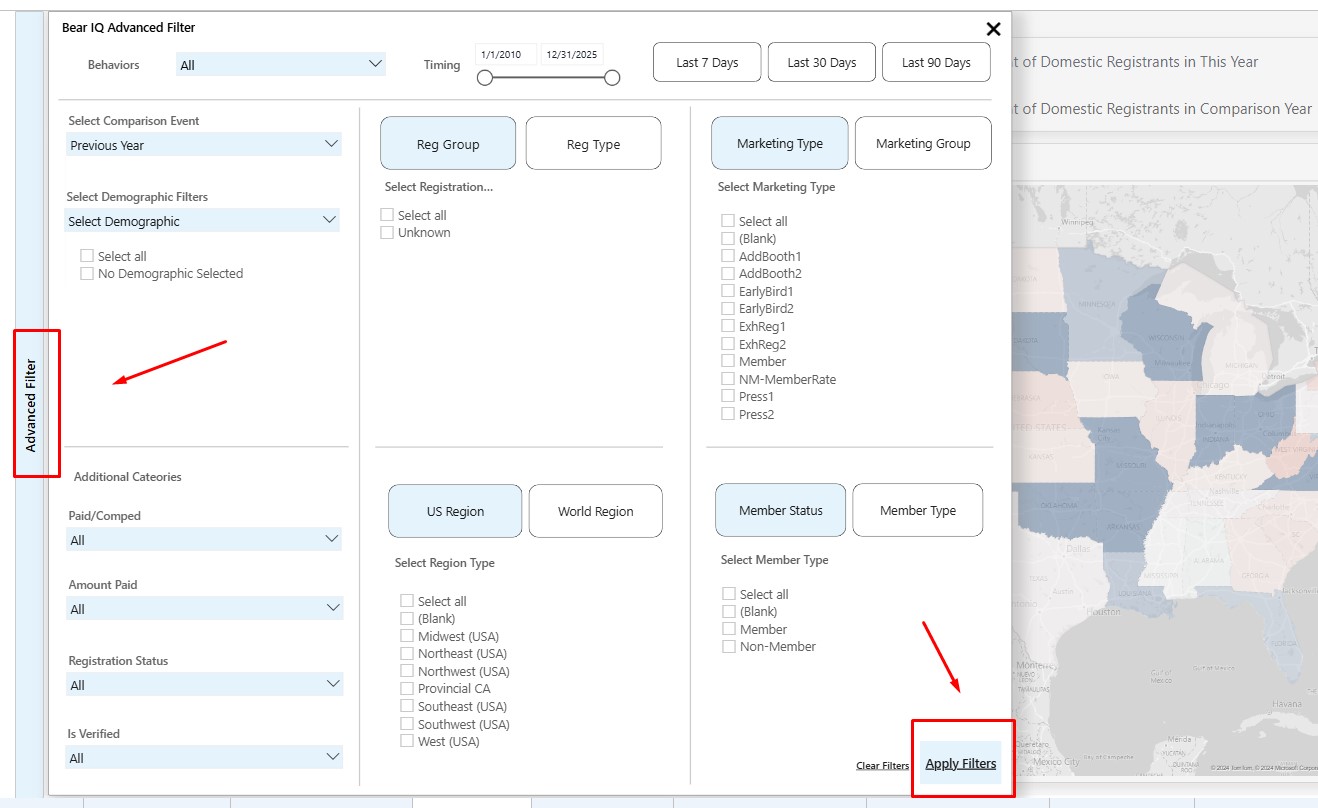
Heads up: Utilize the advanced filters to adjust the comparison year for rotating event locations.
Exploring Features:
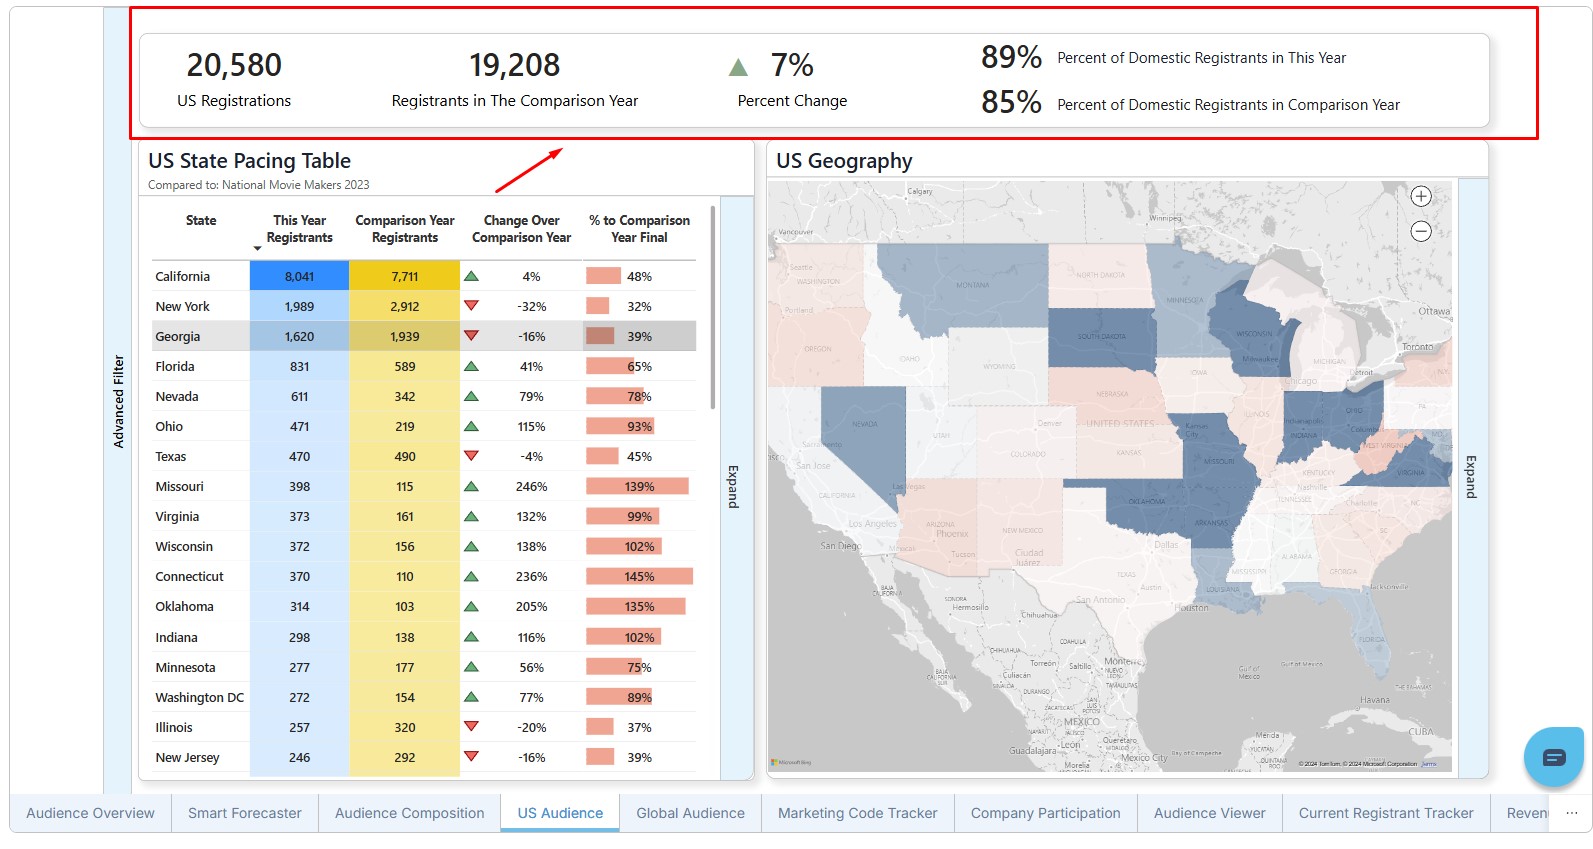
Total US Registrations:
Displays the number of registrants from the US along with their percentage of the total audience.

US State Pacing Table:
View and sort states based on overall numbers or changes over comparison years.

Advanced Filters Slide Out:
Allows selection of different comparison events for event locations that rotate yearly.

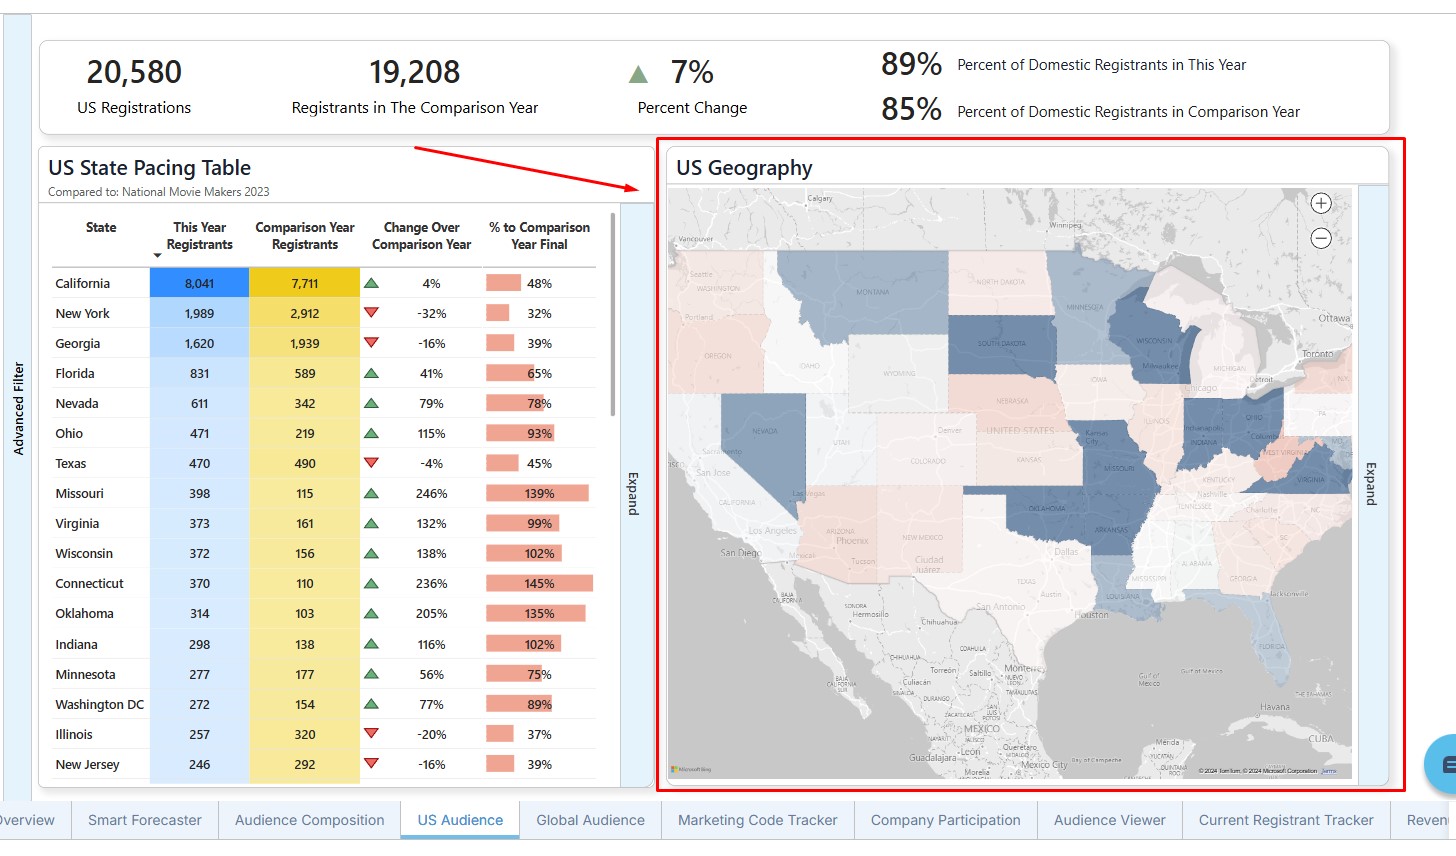
Interactive Map:
Hover over states to view detailed registration insights, with color coding to indicate performance (darker blue for overperformance, darker red for underperformance).

The US Audience pane is a powerful tool for tracking and optimizing your event's reach and engagement on a state-by-state basis, helping you achieve your registration goals.
