The Individual Exhibitor pane provides a detailed, company-specific view of purchase history, revenue contributions, and engagement metrics. It’s a powerful tool for account managers, sales reps, and customer success teams who need to understand the full financial and behavioral picture of a single exhibitor across multiple years.
This page helps teams uncover upsell opportunities, track loyalty, and support relationship-building through deep, historical insight into what each exhibitor has purchased, how much they've spent, and how their presence has evolved.
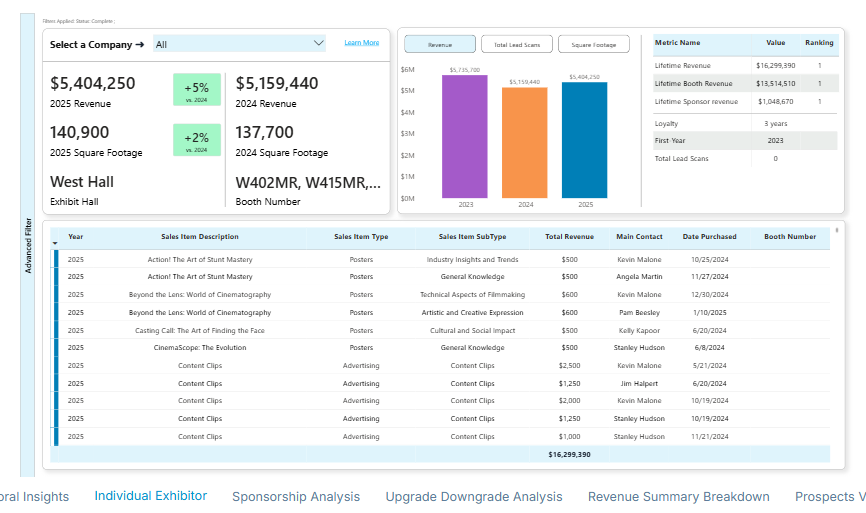
Use the company dropdown at the top to quickly toggle between accounts and instantly see each exhibitor's full transaction history, lifetime value, and ranking—all in one place.
Key Takeaways
Comparison Year Trend
The left panel gives you a direct comparison of current vs. previous years for both revenue and square footage. For example:
-
In 2025, the selected exhibitor has generated $5.4M in revenue, up 5% from 2024.
-
Their booth footprint has also increased to 140,900 sq. ft., a 2% growth, which may indicate higher investment or expanded presence.
Detailed Purchase History Table
The bottom table breaks down all items purchased by the exhibitor across years. This is extremely useful for understanding buying behavior and knowing who to reach out to for reorders or upsells. For instance, Kevin Malone appears multiple times with high-dollar purchases, indicating a key contact.
Lifetime Metrics Panel
On the right-hand side, you can see cumulative totals and rankings. These figures help prioritize high-value accounts and justify VIP treatment or strategic planning attention.
Engagement Over Time (Loyalty & First-Year)
Loyal exhibitors are often easier to retain and are prime targets for multi-year renewal deals. Metrics such as “Loyalty: 3 years” and “First-Year: 2023” show tenure and consistency.
Year over year Comparison
The “Lead Retrieval” metric shows usage, which indicates the exhibitor is active and values interaction with attendees. This kind of engagement data is useful for creating ROI-driven renewal pitches.
The vertical bar chart at the top right quickly visualizes revenue trends across years, showing how an exhibitor’s spending has grown or contracted. This is helpful for identifying patterns (e.g., are they peaking or plateauing?).