Executive Summary Pane
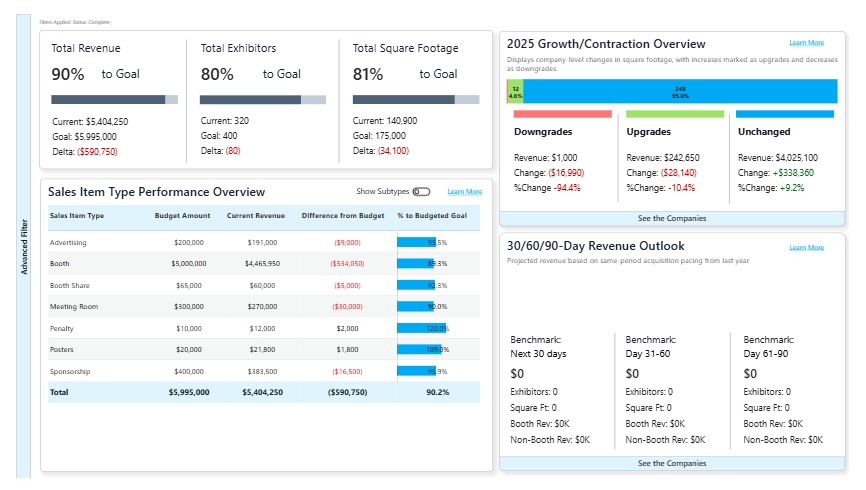
The Executive Summary Pane in Bear IQ's sales dashboard is an essential feature for accessing and evaluating key sales performance metrics in near real-time. With this tool, users can assess total revenue, the number of exhibitors, and square footage reserved, while also determining progress towards sales goals. This guide will help you make the most of the Executive Summary Pane to drive sales strategy and optimize exhibit space utilization.
Tip: Utilize the dropdown feature in the sales KPI center to seamlessly compare performance across different years and gain retrospective insights.
Key Moments to look out for:
Instantly assess your total revenue and exhibitor count.
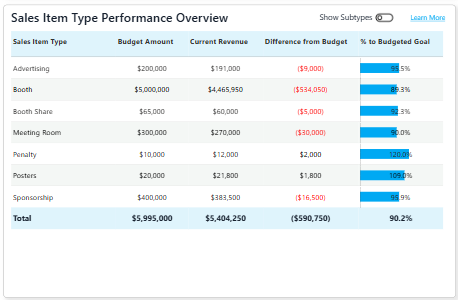
Explore the detailed breakdown of revenue types such as booths and sponsorships.
Easily compare current performance against previous years using the drop-down menu.
Heads up: Collaborate with your Bear IQ account manager to set accurate sales goals and regularly review them for optimal performance tracking.

Key Features:
KPI Overview
The Executive Summary Pane offers quick access to key performance indicators, providing an at-a-glance perspective of your sales landscape, including total revenue, exhibitor count, and goal-pacing.

Sales Item Type Breakdown
Below the KPI overview, gain a comprehensive view of various revenue types captured during the sales cycle, enabling better sales strategy formulation.

Advanced Filtering
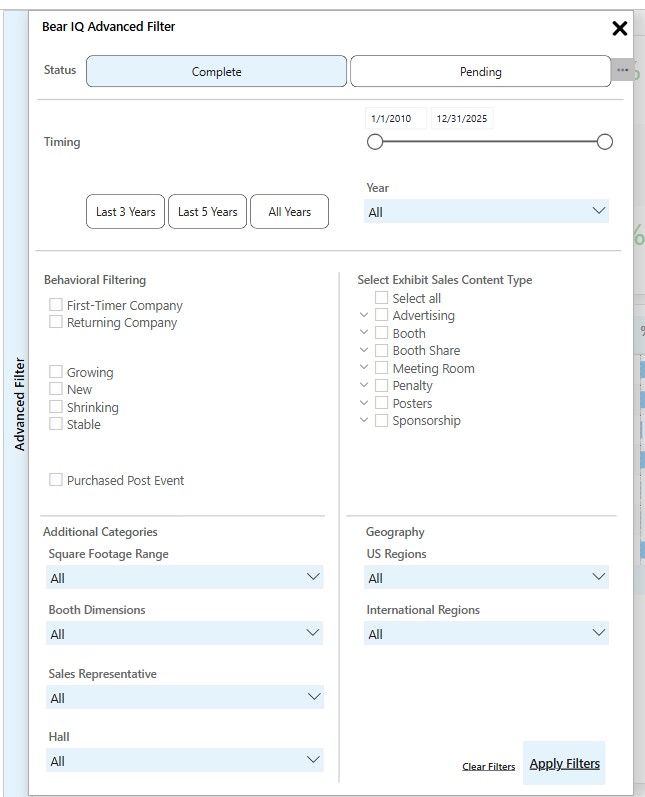
Use advanced filters to dive deeper into your data, such as exploring pending transactions or differentiating performance between first-time and returning exhibitors.

The Executive Summary Pane in Bear IQ is a powerful tool that equips users with vital sales insights, enabling informed decision-making and enhanced exhibit sales strategies.
