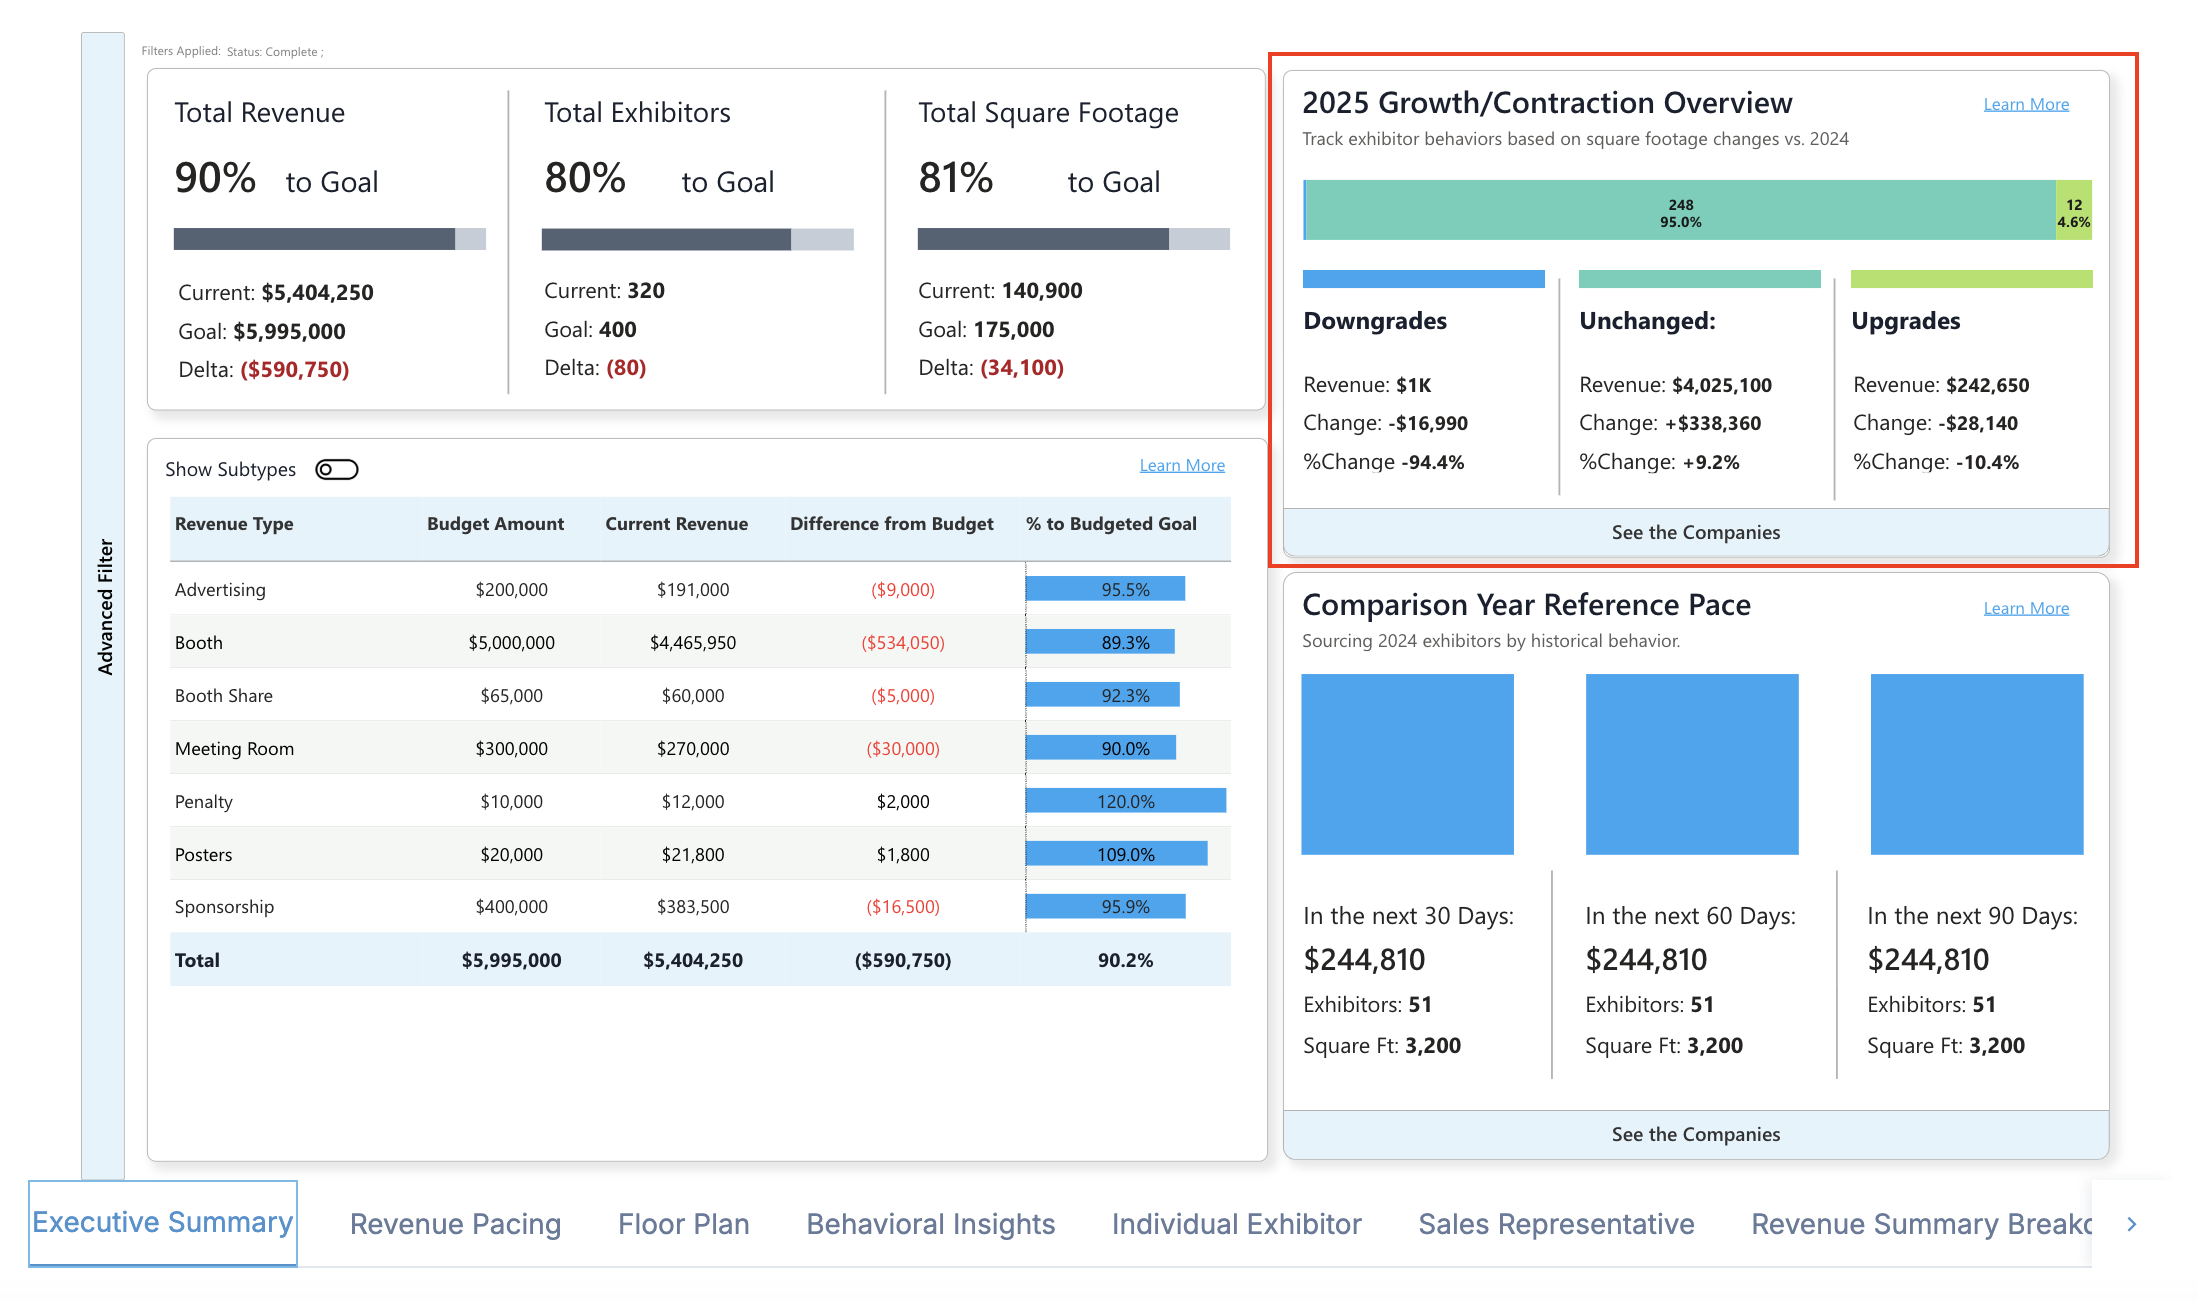
The Growth and Contraction Overview graph is a vital tool for tracking exhibitor behaviors through changes in square footage from the previous year. This visual offers a clear snapshot of how different exhibitors have adapted, providing insights into downgrades, stability, and upgrades.
It's particularly useful for executives looking to understand market dynamics and make informed strategic decisions.
Tip: Hover over each section of the graph to reveal detailed data about specific exhibitors, allowing for a deeper dive into individual performance metrics
Key Takeaways
1. Comprehensive Overview
The graph divides exhibitors into Downgrades, Unchanged, and Upgrades categories. This segmentation allows users to quickly assess how different groups are performing and identify areas for intervention.
Example: If you notice many exhibitors in the Downgrades category, it might indicate industry challenges or dissatisfaction that needs addressing.
2. Revenue Insights
Each category shows associated revenue figures, providing a quick understanding of the financial impact of space changes. This helps in evaluating which segments contribute most to overall revenue.
Example: A high revenue in the Unchanged category suggests stability, indicating that maintaining relationships in this group could secure a stable income base.
3. Percentage Change Analysis
The %Change metric offers insights into the magnitude of changes experienced by each category. This enables users to prioritize efforts based on the severity of growth or contraction.
Example: A large negative %Change in Downgrades might prompt a review of exhibitor satisfaction and competitive offerings to stop potential attrition.
4. Visual Segmentation
Color-coded bars create an immediate visual impression of exhibitor distribution across categories. This aids in quickly grasping the status of exhibitor activities, allowing for rapid assessments and decisions.
Example: If most exhibitors are in the Unchanged category, it suggests a stable environment, but a strategy might be needed to encourage more upgrades.
5. Detailed Change Metrics
Specific change values indicate exact shifts in revenue, helping to pinpoint areas requiring attention and adjustment to strategies for improvement or maintenance.
Example: Identifying significant revenue loss in Downgrades can lead to targeted marketing efforts to re-engage these exhibitors.
6. Interactive Elements
By using the "See the Companies" feature, users can delve deeper into specific exhibitors, allowing for a focused analysis that can drive personalized strategies and communications.
Example: By exploring individual exhibitors in the Upgrades category, you can identify successful strategies or market demands to replicate across other segments.