Bear IQ's Portfolio Module provides a comprehensive view of all event data you've collected throughout the year, empowering event organizers to analyze key performance indicators and optimize event strategies. From your largest annual conferences to smaller regional gatherings, this module offers insights into unique registrations, revenue breakdowns, and more. This article will guide you through utilizing the Portfolio Module to extract meaningful insights and drive data-driven decisions for your events.
Tip: Leverage the advanced filters to zero in on specific years or demographic groups to tailor your analysis.
Key moments to look out for:
-
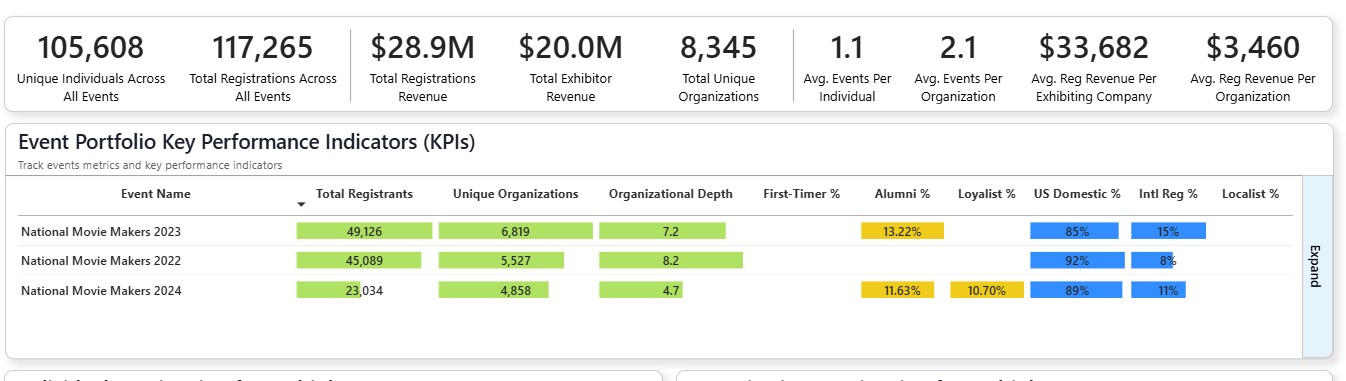
Observing unique individual counts and total registrations across events
-
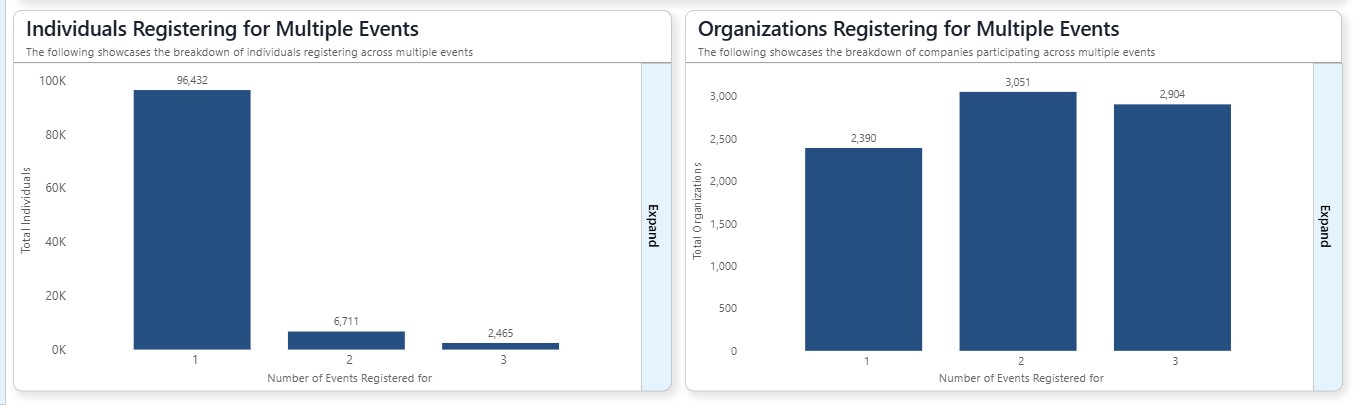
Identifying individuals and organizations attending multiple events
-
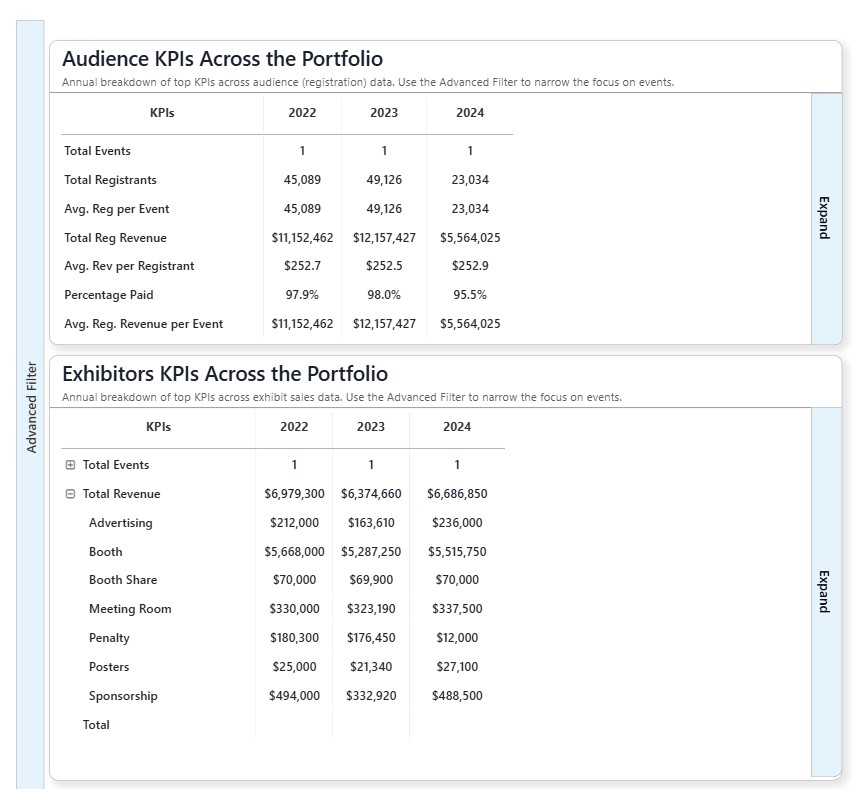
Heads up: You can review exhibitor KPI performance in the executive view
Exploring features:
Topline KPIs:
Begin by examining the topline KPIs that give you real-time insights into unique individuals, total registrations, and revenue breakdowns. This information is essential for gauging your event's overall performance.
Portfolio View:
Analyze trends such as the number of individuals and organizations attending multiple events. This can provide insights into attendee loyalty and engagement across your event portfolio.
Executive View:
Navigate to the executive view for a detailed breakdown of registrant numbers, revenue, and average revenue per registrant. Additionally, review annual exhibitor KPI performance to understand the broader impact on your events.
Data Export:
Remember, you can easily export your compiled data by clicking the export button in the top right corner, ensuring you have access to this information for offline analysis or reporting.
Utilizing Bear IQ's Portfolio Module for in-depth event analysis equips you with the necessary insights to refine your event strategy, ultimately leading to enhanced planning and execution.