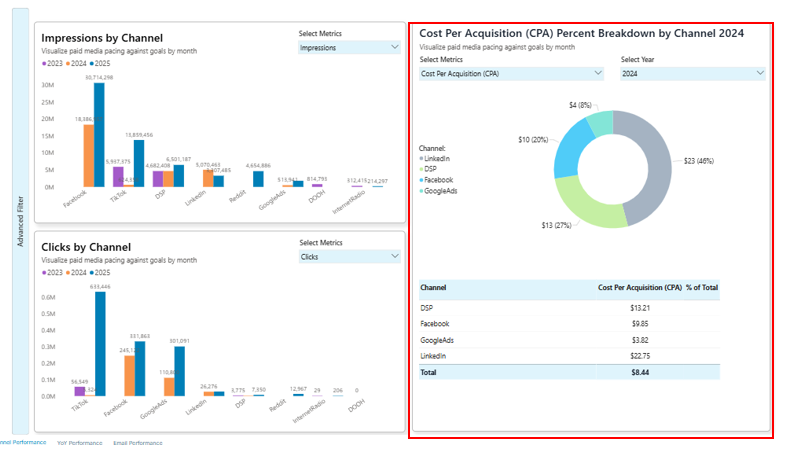
The Channel Performance Pane in the Marketing Module provides a consolidated view of how paid media channels are performing across key metrics such as impressions, clicks, conversions, conversion rate , click through rate and cost per acquisition (CPA). This pane helps marketers analyze campaign effectiveness, identify cost efficiencies, and understand which channels are driving engagement.
Tip: Use select year view to spot performance growth or declines for each channel for any historical year as well.
Tip 2: Compare CPA breakdowns across channels to optimize media spending and allocate budgets effectively.
Heads up: Always explore channel-specific data for deeper insights into your campaign performance.
Exploring Features
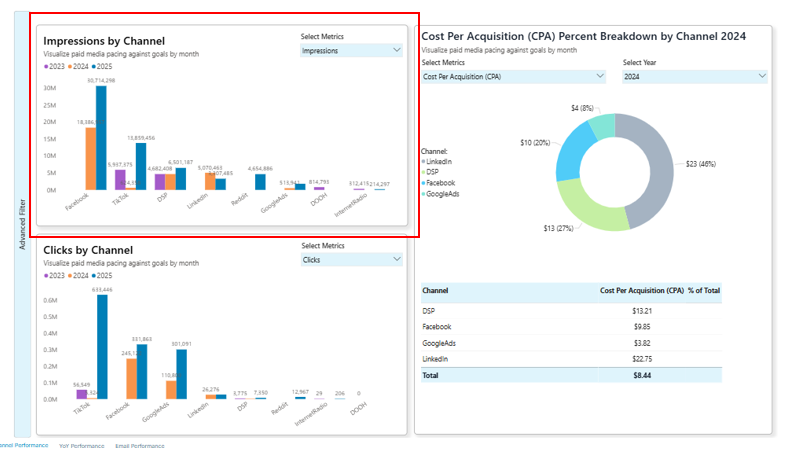
Impressions by Channel
This chart highlights impression delivery by channel over time, helping marketers track visibility and audience reach.
-
Provides a clear channel-level breakdown (e.g., Facebook, TikTok, DSP, LinkedIn, Retail).
-
Highlights yearly comparisons, enabling quick identification of growth or declines across various years.
-
Allows filtering by metrics such as CTR, CVR, clicks, conversions, and CPA etc for deeper insights.
-
Useful for spotting under-performing channels where impressions fall significantly.
-
Supports strategic budget reallocation by revealing high-performing channels.
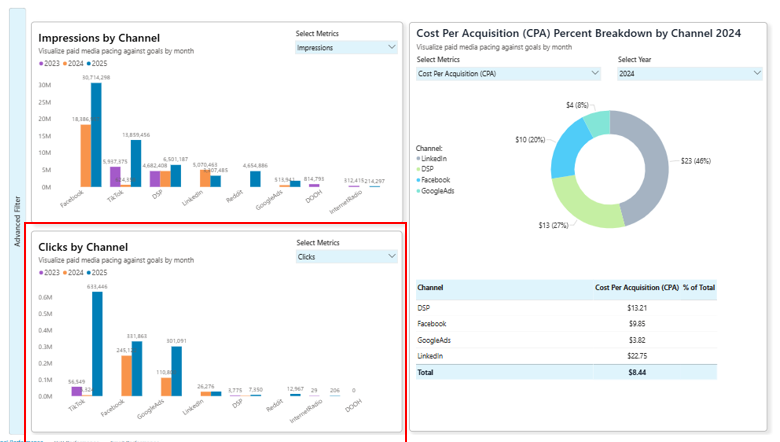
Clicks by Channel
This visualization shows how impressions translate into clicks, enabling analysis of engagement across different channels.
-
Shows click volumes per channel over 2023–2025.
-
Highlights differences in engagement efficiency, e.g., TikTok vs. GoogleAds.
-
Enables marketers to assess whether high impression channels are also delivering meaningful clicks.
-
Identifies cost-efficient engagement opportunities by comparing clicks against impressions.
-
Provides an early indicator of potential conversion pipeline strength.
-
Filters allow viewing by alternative performance metrics for flexibility.
Cost Per Acquisition (CPA) Percent Breakdown by Channel 2025
This donut chart and table show the share of selected metrics by channel, clarifying where acquisition costs are concentrated for the selected year.
-
Illustrates the share of CPA or the selected metric by channel as a percentage, making cost concentration easy to identify.
-
Table view complements the chart, providing precise values and totals.
-
Highlights opportunities to lower overall acquisition costs by shifting spend toward efficient channels.
-
Useful for identifying budget risks where one channel dominates CPA share disproportionately.
-
Breaks down each channel’s contribution both in cost and percentage of total.
-
Helps finance and marketing teams align on spend effectiveness.
-
Serves as a reference for benchmarking cost efficiency across multiple campaigns.