The 30/60/90 - Day Revenue outlook section is designed to help sales, marketing, and event operations teams track progress toward sourcing returning exhibitors based on prior-year behaviors. It focuses specifically on exhibitors from the previous event and projects their expected rebooking behavior across 30, 60, and 90-day timelines. This insight supports pipeline planning, sales pacing, and benchmarking current outreach efforts against historical data.
Use this chart as a benchmarking tool to guide your sales goals. If your current progress is lagging behind the historical rebooking pace, it’s a signal to accelerate outreach or refine your offer strategy.
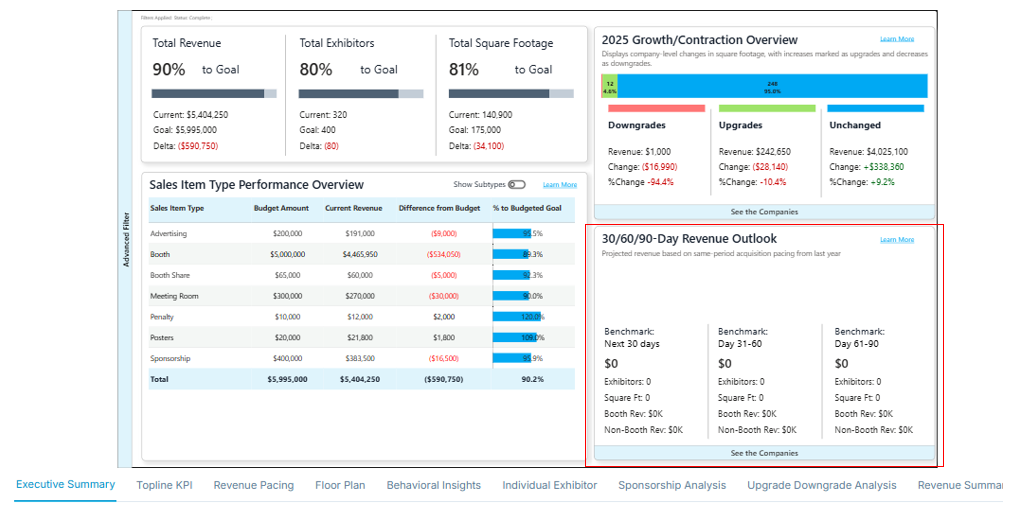
Key Takeaways
Tracks Historical Rebooking Pace
Understand how many exhibitors booked during this same period last year, giving your team a tangible goalpost to work toward.
Breakdown by Time Intervals
The chart shows projections for the next 30, 60, and 90 days, making it easy to set short-, mid-, and long-term priorities for your outreach.
Quantifies Revenue Opportunity
Each time window (30, 60, 90 days) shows a projected revenue, helping leadership quickly understand what's potentially at stake.
Consistent Exhibitor Metrics
You can clearly see the expected exhibitors in each time segment—ensuring alignment between revenue expectations and exhibitor count.
Square Footage Planning
With the square feet projected in each period, operations teams can begin forecasting space allocation based on realistic benchmarks.
Booth and Non-Booth Revenue
With the booth and non-booth revenue projected in each period, operations teams can begin forecasting revenue based on realistic benchmarks.
Drill-down Option
The “See the Companies” link enables users to view which specific exhibitors contributed to these figures in the historical years and current year—ideal for targeted re-engagement.