The Revenue Pacing pane is your central hub for tracking sales performance in real-time relative to past years and future projections. Designed for sales managers, revenue teams, and leadership stakeholders, this view combines forecasting, historical pacing, and live progress to help you make informed, timely decisions that directly impact revenue outcomes.
Click the toggle in the upper-right corner of the chart to switch between cumulative vs. aggregate views—this is a powerful way to uncover short-term dips or surges that could otherwise be masked in cumulative curves.
Key Takeaways
Real-Time Revenue Forecasting
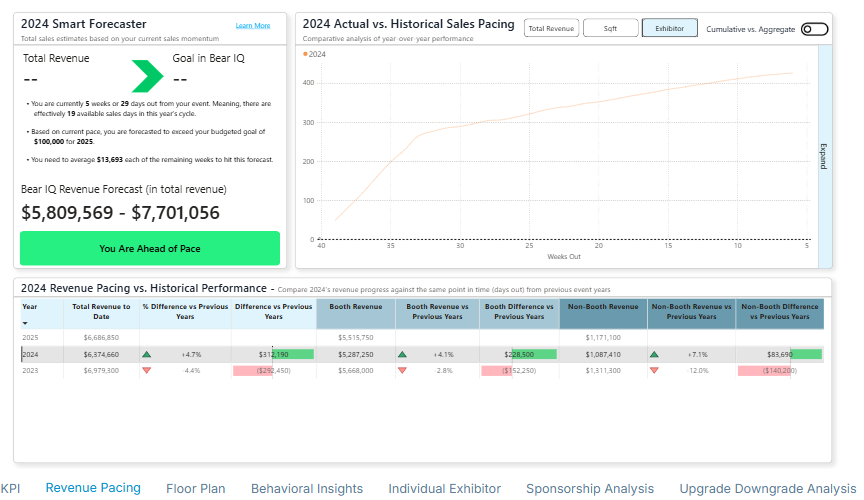
The "Smart Forecaster" gives a dynamic range based on your current momentum, so you always know where you're headed. It uses your current sales velocity to project a realistic revenue range.
For example, in the screenshot, it predicts total sales will fall between $5.8M and $7.7M. This helps you prepare best- and worst-case scenarios and allocate resources accordingly
Clear Pace Indicator
The green badge (“You Are Ahead of Pace”) instantly lets you know how your current trajectory compares to your budgeted goals. It takes the guesswork out of whether you’re behind, on track, or ahead.
Time-Sensitive Guidance
The forecaster tells you how much time remains (e.g., 5 weeks or 29 days), but more importantly, how many effective sales days are left (e.g., 19 days), so your planning stays grounded in reality.
Weeks Pacing
The system does the math for you. To hit your top-end goal, it shows exactly how you are performing in each week and gives you the forecasted number to achieve to keep up with the pace (e.g., $270,213 per week). This becomes an immediate KPI your team can rally around.
Contextual Historical Comparison
The pacing chart to the right shows how your current revenue stacks up against historical years on a week-by-week basis. You can easily identify whether this year’s curve is accelerating faster—or lagging behind.
Granular Revenue Breakdown
The data table below splits out booth revenue vs. non-exhibitor revenue and compares them against previous years.
For instance, in 2025, booth revenue is up 2.9% over 2024, and non-exhibitor revenue is up 12.4%.
Quick Insights for Strategy Adjustments
If you see you're ahead but non-exhibitor revenue is lagging, that might be your cue to target sponsors. If booth revenue is strong but exhibitor count is low, it could mean larger booths—but fewer logos on the floor.