The Email Performance Pane in Bear IQ offers you vital insights into your marketing efforts for all email campaigns executed this year. It highlights metrics such as average open rates and click-through rates, comparing them against established goals and benchmarks from your onboarding. This article will guide you in utilizing these insights to optimize your marketing strategies and evaluate individual campaign effectiveness.
Tip: Use the advanced filter feature to quickly compare specific campaigns across different time periods.
Key moments to look out for:
-
Switching between overall open rates and click-through metrics to gain a clearer view.
-
Sorting columns to identify top-performing campaigns.
-
Using the advanced filter to drill down into specific campaigns or timeframes.
Heads up: Remember, sorting and filtering are key to uncovering valuable insights and enhancing your campaign strategies.
Exploring Features:
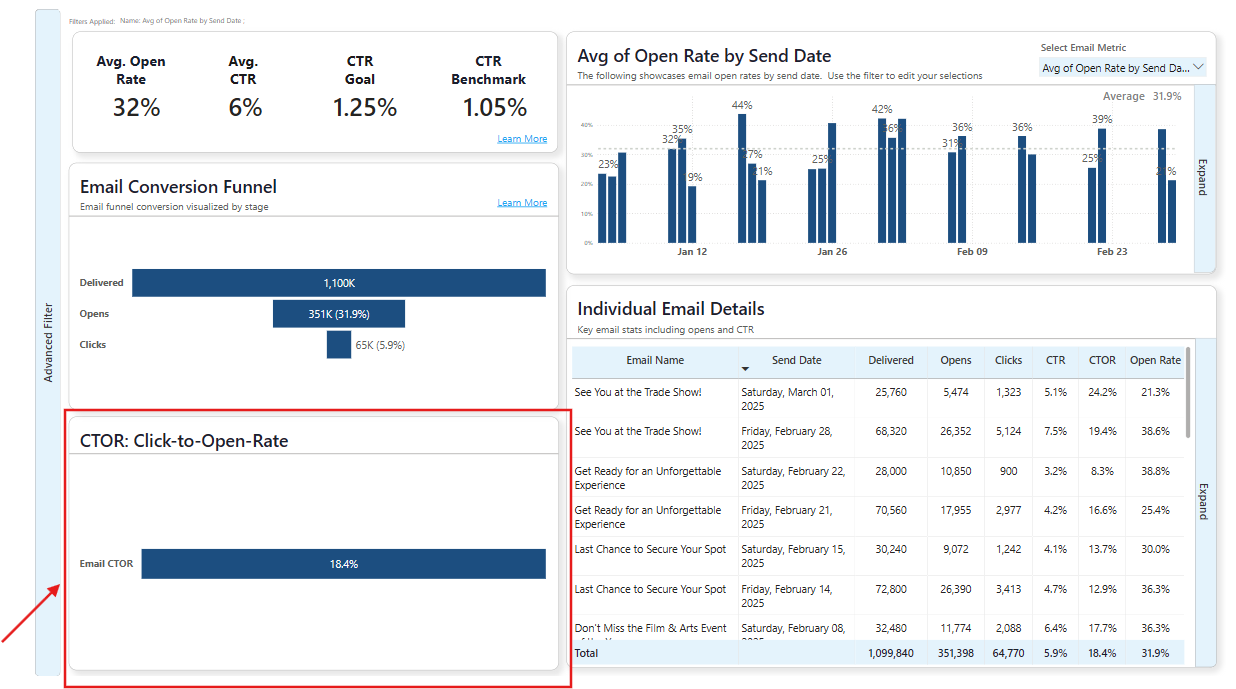
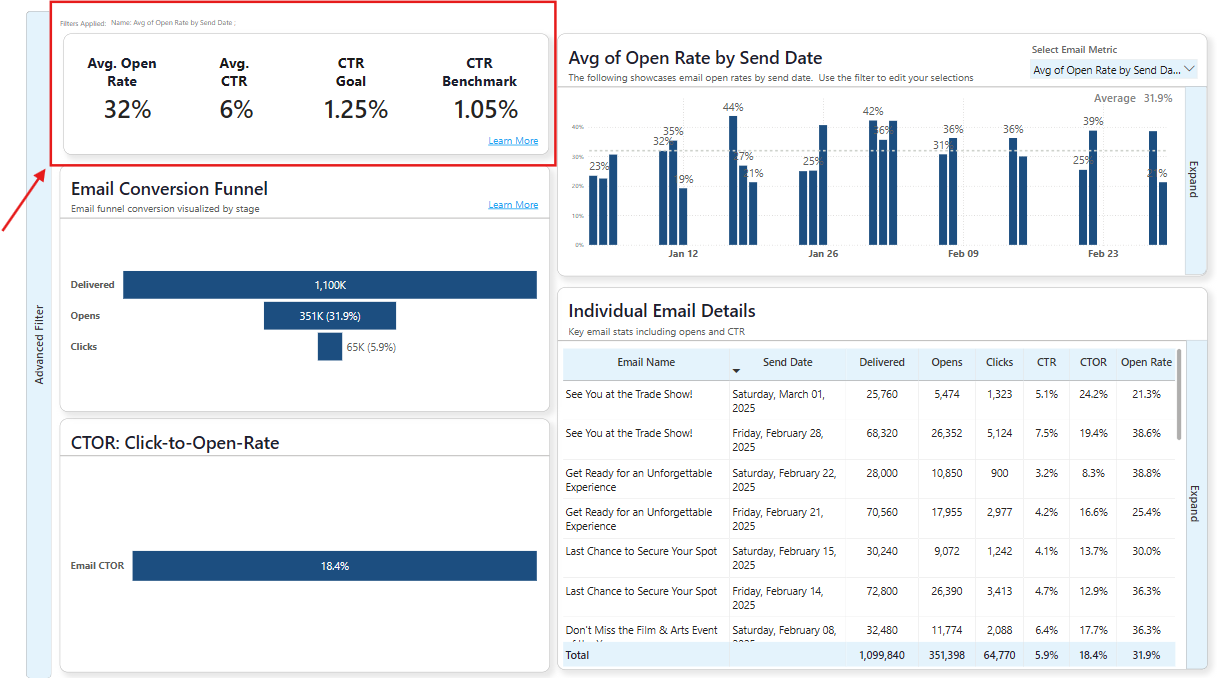
Summary Metrics:
This section provides a quick glance at your campaign performance by displaying key metrics such as the average open rate, average click-through rate (CTR), CTR goal, and CTR benchmark.
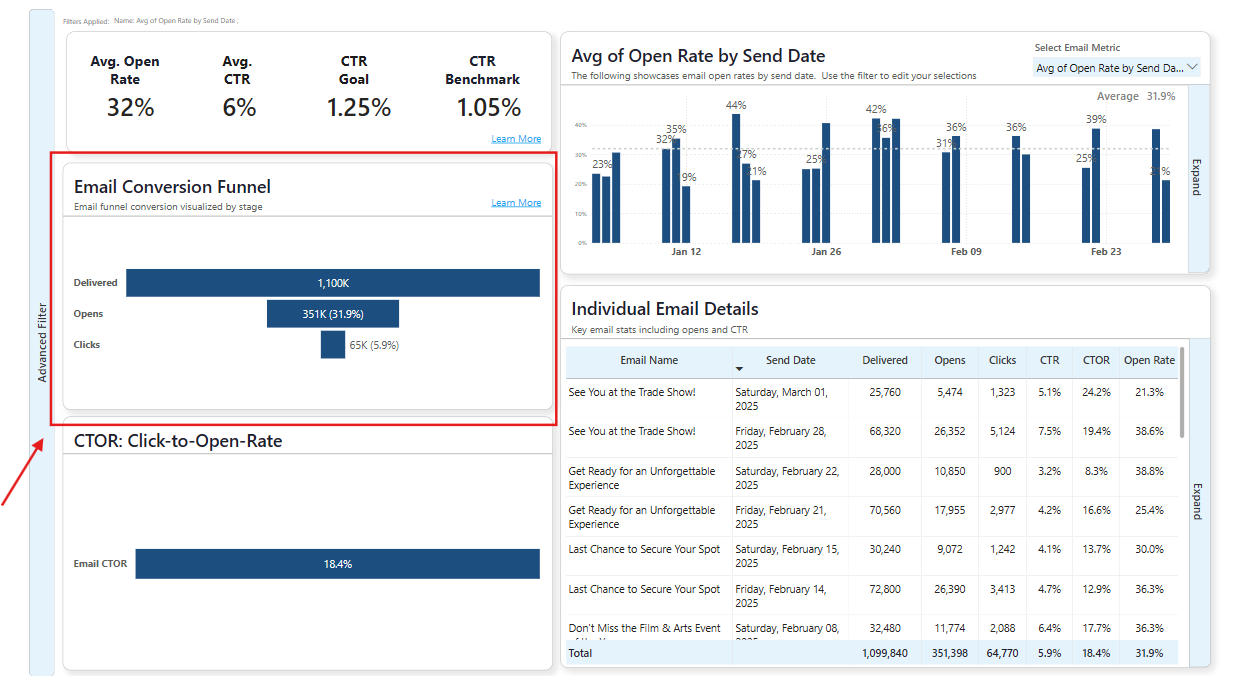
Email Conversion Funnel
Visualizes the email funnel conversion by stages—delivered, opens, and clicks. This helps you track the overall flow and effectiveness of your campaign in converting emails into actions.
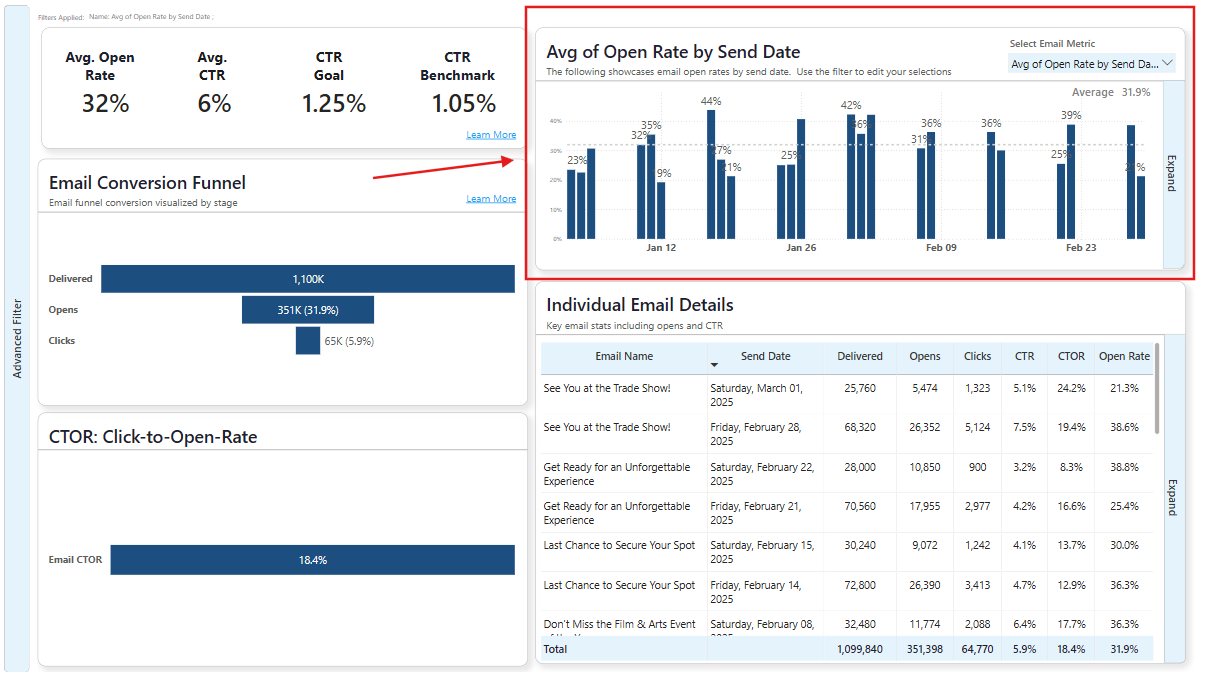
Email Metrics:
A bar graph illustrates open rates by send date, allowing you to identify trends and patterns over time, and adjust your strategy accordingly. Toggle between different metrics, such as open rates and click-through rates, to dive deeper into specific areas of your marketing efforts.
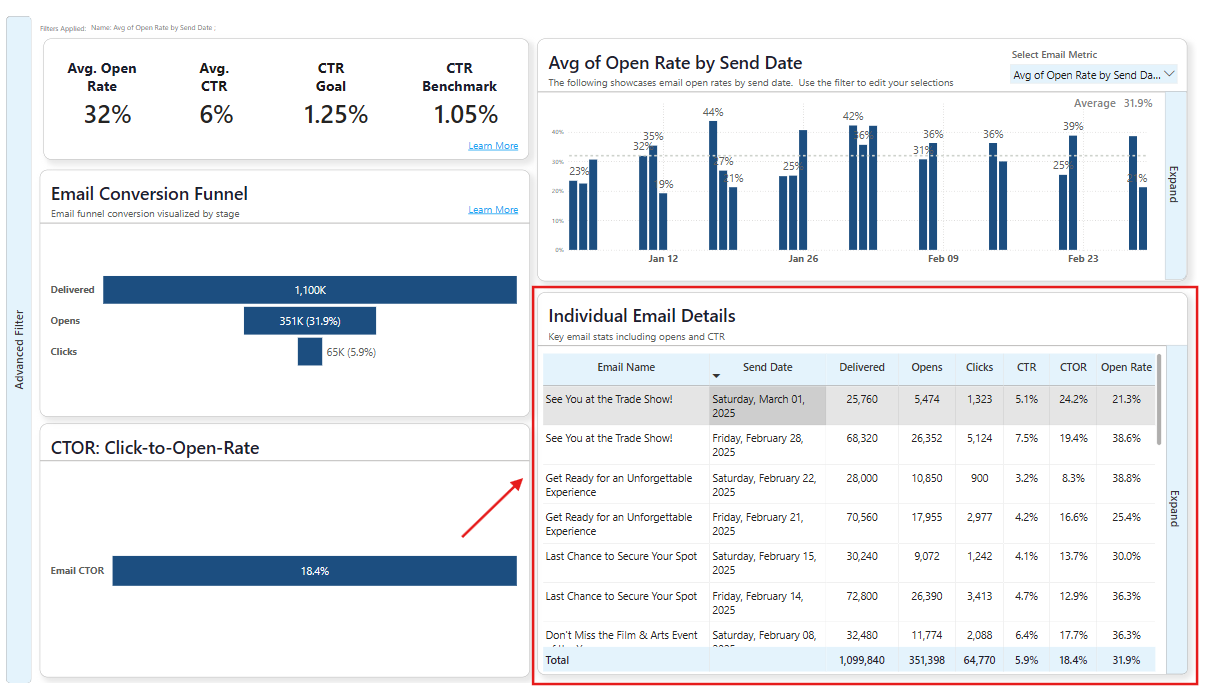
Sort Individual Emails
This detailed table lists individual email campaigns, showing metrics like delivery date, number of emails delivered, opened, and clicked, along with CTR, click-to-open rate (CTOR), and open rate for each campaign.
Content Engagement Effectiveness
Highlights the overall click-to-open rate, revealing how effective your content is in driving clicks relative to opens. Measure how well your email content converts opens into clicks with the click-to-open rate insights.