The Floor Plan pane helps event and operations teams analyze how booth size distribution impacts overall revenue, square footage allocation, and exhibitor trends year-over-year. This view is critical for space planners, revenue managers, and executive decision-makers looking to optimize the floor layout for both financial performance and exhibitor satisfaction.
By visualizing how different booth size categories contribute to total revenue and tracking changes over time, users can fine-tune floor planning strategies and spot shifts in exhibitor preferences.
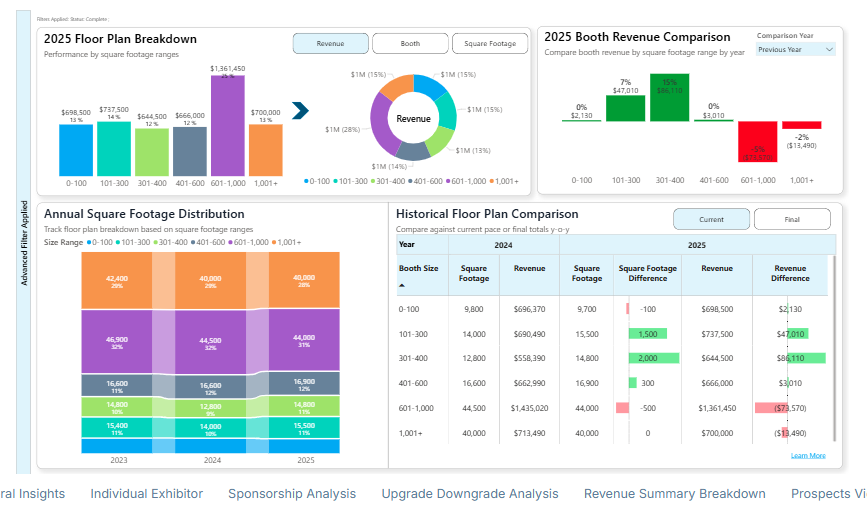
Toggle between Revenue, Booths, and Square Footage views at the top of the dashboard to see how your floor plan strategy affects different business outcomes—not just earnings, but physical footprint and exhibitor mix too.
Key Takeaways
Floor Plan Breakdown:
The bar chart in the top-left shows exactly how much revenue each booth size category contributed in your current year event. For example, 601–1,000 sq. ft. booths generated the highest revenue at $1.36M, accounting for 30% of total booth sales.
Floor Plan Breakdown Comparison to Previous Year
The comparison chart (top-right) shows where revenue increased or decreased by size category.
For example, booths in the 301–400 range saw a +17% increase ($93,610), while 601–1,000 dropped by -2%.
Multi-Metric Toggle View
Switching between Revenue, Booths, and Sqft at the top of the charts gives different perspectives—for example, one size range might be high in revenue but low in booth count, which could influence pricing strategies.
Floor Plan Annual Breakdown
The stacked bar chart (bottom-left) lets you track how floor space was allocated by size over three years. This is useful for identifying whether large booths are gaining or losing share over time (e.g., 1,001+ booths decreased from 42,400 in 2023 to 40,000 in 2025).
Current Year vs Historical Analysis Comparison
The “Current year vs. Historical Floor Plan Mix” table (bottom-right) allows detailed year-over-year comparison of both square footage and revenue for each size category. This helps justify layout decisions, like allocating more 301–400 booths after seeing a revenue increase from $558,390 in 2024 to $644,500 in 2025.
Identifies High-Performing Segments
The donut chart in the center highlights which booth sizes drive the biggest revenue share—helping prioritize outreach or incentives to those segments in future planning.