This page guides you through understanding the revenue summary table by sales item type within Bear IQ. This view is vital for evaluating how various streams—such as booths, enhanced listings, and sponsorships—are contributing to your overall revenue goals. By learning to interpret these columns, you can quickly identify high-performing categories and potential shortfalls. Leveraging this information supports effective data-driven decisions for your event or portfolio.
Tip: Quickly spot revenue gaps by comparing the “Current Revenue” to “Budget Amount” to focus your follow-up efforts.
Key Takeaways:
1. Revenue break down by Sales Item Type
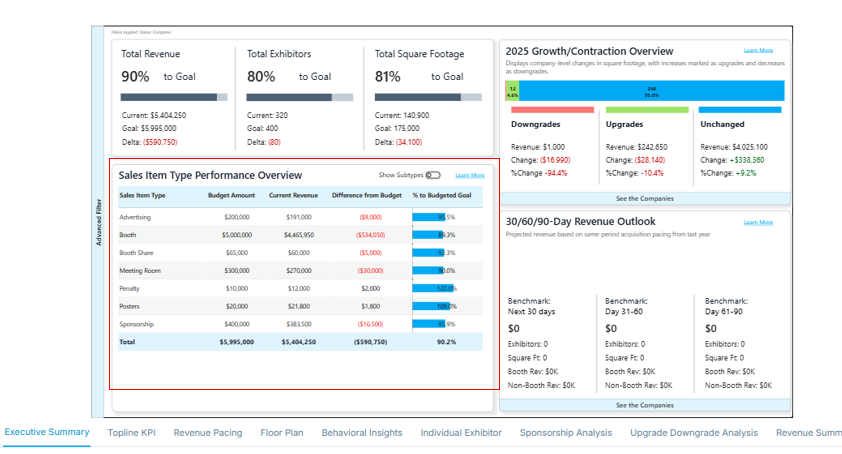
This chart breaks down your event revenue by source—such as Booth Sales, Sponsorships, and Enhanced Listings—so you can easily identify where your income is coming from. In Bear IQ, these sources can be grouped or customized to match your reporting preferences. Use the toggle in the top left corner of the chart to view detailed revenue subtypes.
2. Budget vs. Actual Revenue
For each revenue type, the chart displays both the Budget Amount and Current Revenue, making it easy to compare your projected earnings with actual performance. In Bear IQ, the Budget Amount is a customizable field where you can input your revenue goals for the year.
3. Highlight Performance with “Difference from Budget”
The "Difference from Budget" column helps identify which categories are over-performing or under-performing compared to expectations. This metric is automatically calculated in Bear IQ by comparing your entered Budget Amount with actual revenue.
4. Identify Zero or Missing Revenue Categories
Any rows showing $0 revenue or no budget highlight areas that either haven't generated income yet or were not expected to contribute revenue.
5. Calculate % Toward Budget Goal
The "% to Budgeted Goal" column helps measure progress for each revenue stream, indicating how close each is to meeting its target. In Bear IQ, this percentage is automatically calculated by comparing actual revenue against the Budget Amount you've set.
6. Summarize Total at the Bottom
The Total row at the bottom provides a quick snapshot of your overall event revenue, helping you assess financial health at a glance. It aggregates all revenue types for the current year into a single, comprehensive view.