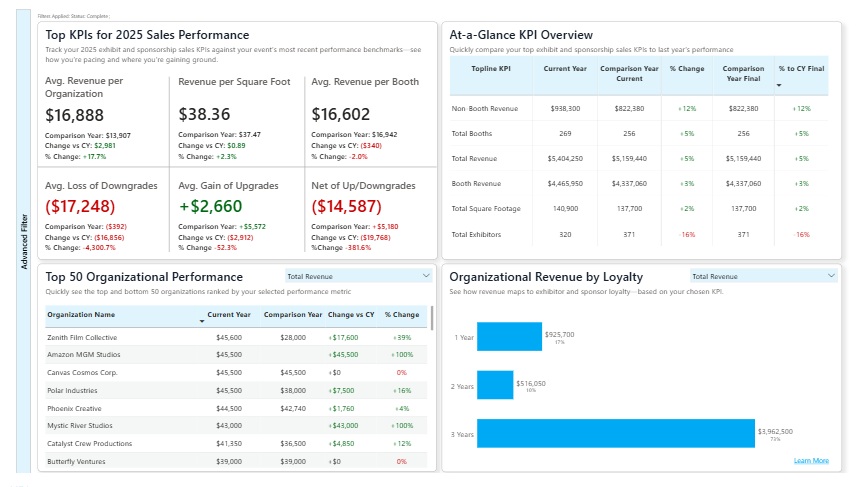
Topline KPI Pane
The Topline KPI pane offers a high-level performance snapshot ideal for executive leaders, revenue strategists, and operations teams who need to track year-over-year progress across key business drivers.
This view includes metrics like average revenue per exhibitor, upgrade/downgrade value shifts, total revenue, and square footage—all contextualized by comparison to prior years. It’s a foundational dashboard for revenue planning, pacing reviews, and strategic forecasting.
Use the Organizational Revenue by Loyalty to guide loyalty programs or early renewal incentives. Organizations in their second or third year are your most valuable—they're worth retaining with extra care, perks, or exclusive upgrade opportunities.

Key Takeaways:
Tracks Core Performance Indicators Across Time
The pane summarizes critical topline metrics such as total revenue, booth count, square footage, and exhibitor participation—while comparing them to previous cycles to highlight year-over-year movement.Surfaces Revenue Efficiency Metrics
Metrics like average revenue per organization or per square foot help teams understand how efficiently space and relationships are being monetized, independent of volume.Highlights Exhibitor Movement and Value Shifts
Upgrade and downgrade data show how organizations are changing their level of commitment, offering insight into exhibitor satisfaction, sales effectiveness, and expansion opportunities.Enables Quick Identification of Revenue Drivers
By combining booth and non-booth revenue data, the pane makes it easy to see which streams are growing and which may need more attention or rethinking.Reinforces Long-Term Value Thinking
Lifetime value comparisons by exhibitor tenure help teams prioritize retention efforts and recognize the strategic value of multi-year engagement.
