We're excited to announce a new look and feel for your Bear IQ homepage! Our team has been working hard to create a more intuitive and personalized data experience based on your feedback. We've simplified the layout, improved navigation, and are surfacing the settings and data tuning features you use most. With more to come!
Login to your Bear IQ Dashboard at app.beariq.com
Accessing your modules
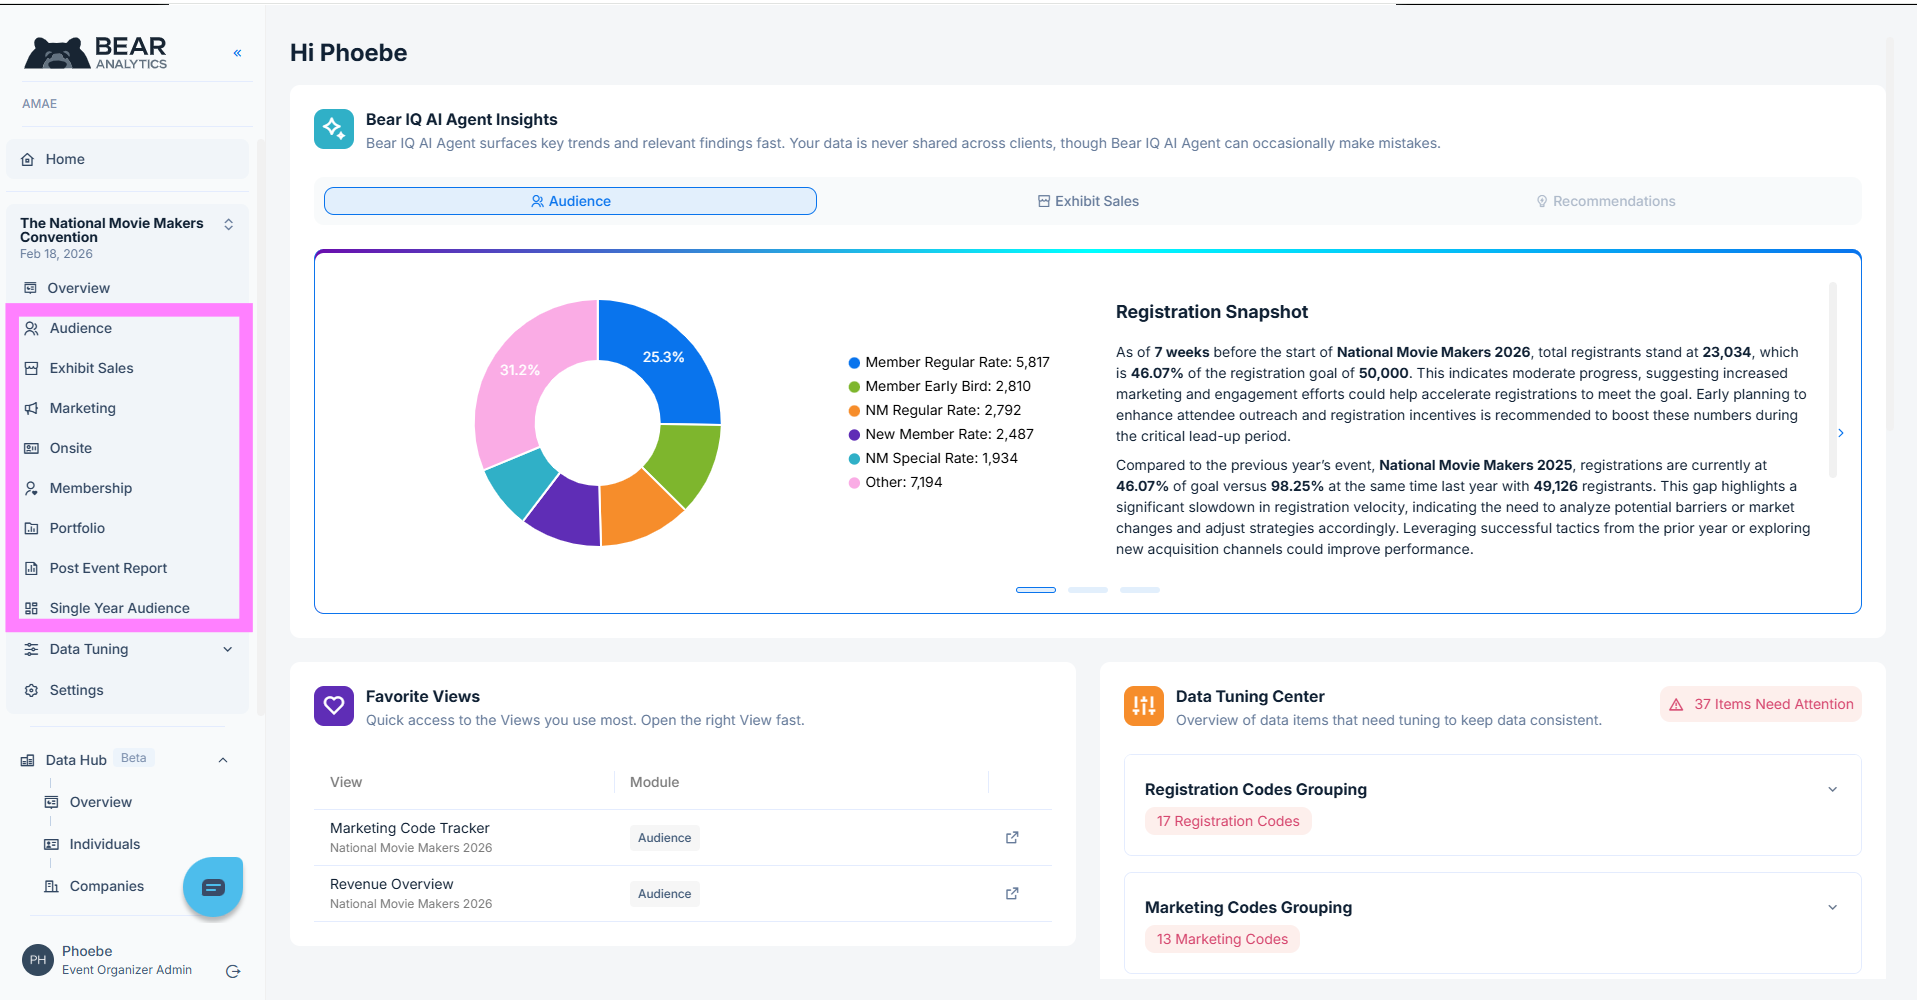
Use the left sidebar to jump into your event’s modules. Each one unifies your data into clear, actionable insights so you can track performance and decide faster
Easily switch between events
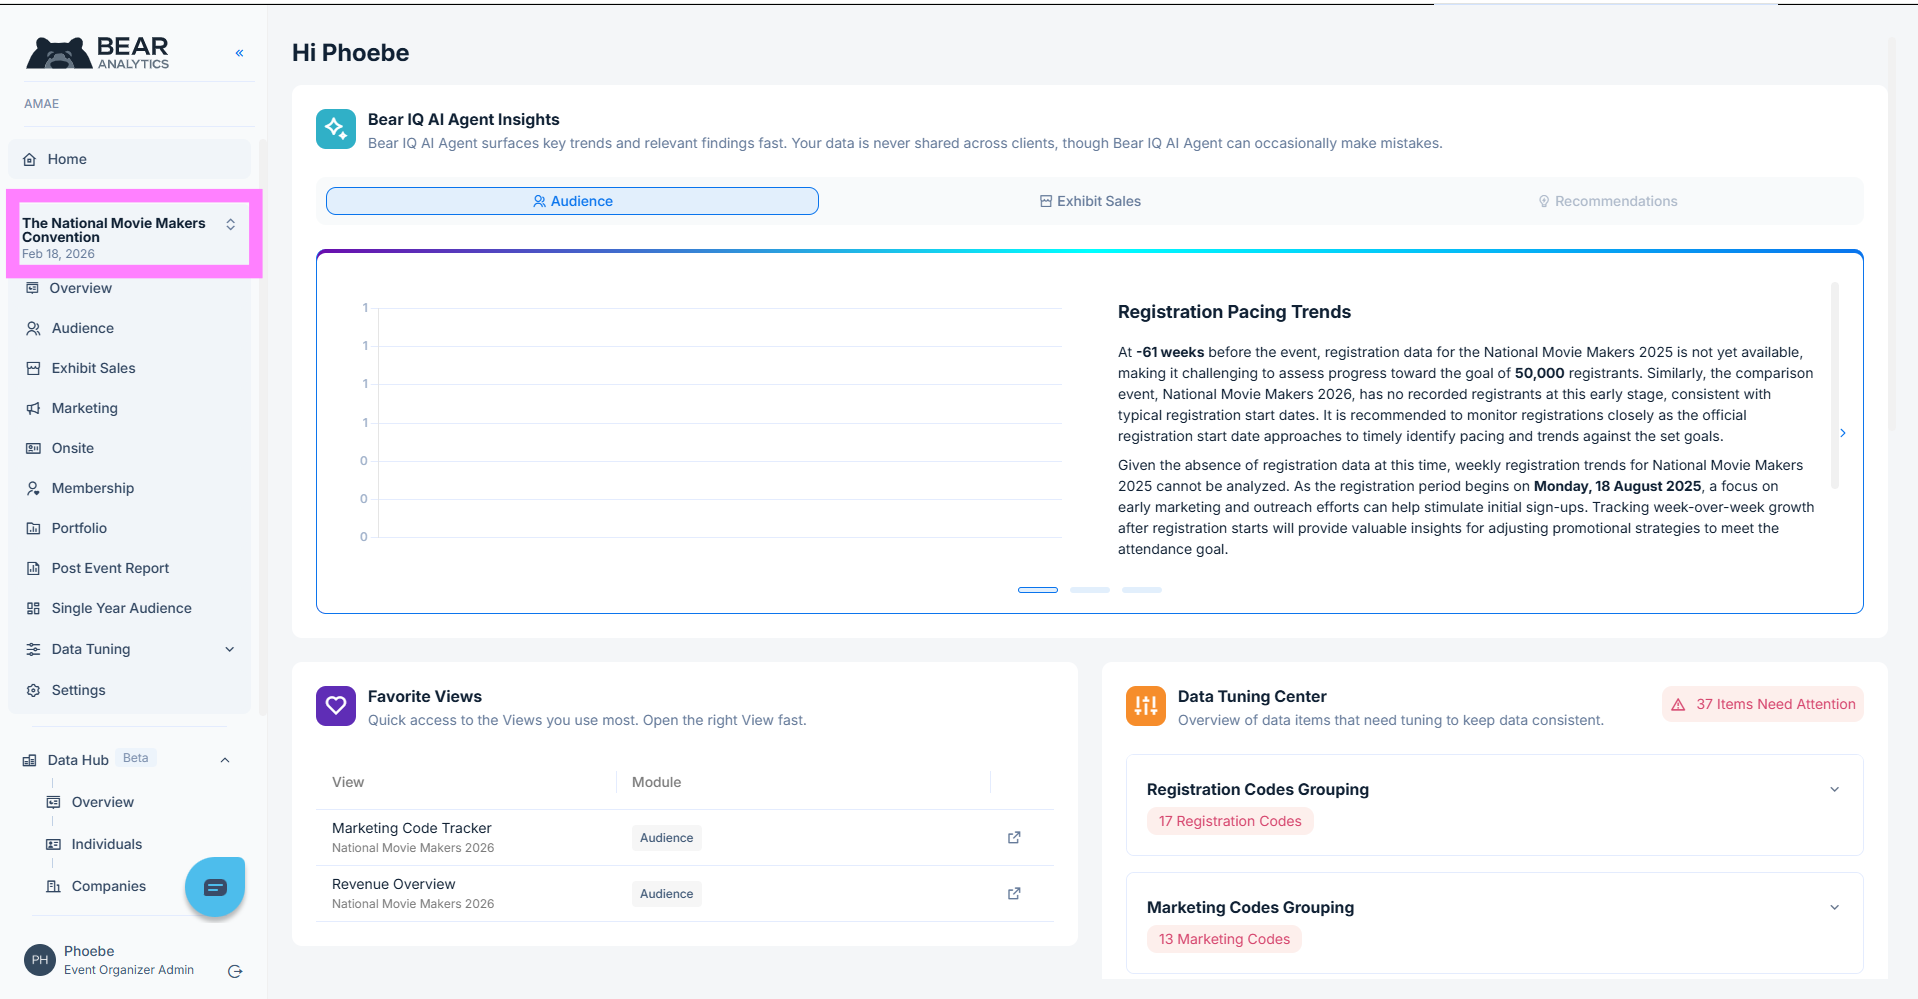
As more organizations manage multiple events in Bear IQ, we’ve built a simple way to move between them. The event toggle—located in the homepage header—allows you to seamlessly switch your analysis view without leaving the platform.
Why It Matters
Many Bear IQ customers run more than one event each year, and they want to analyze performance across years of the same event. Without an easy way to switch views, data can feel fragmented. The toggle solves this by giving you one place to navigate between individual events and broader event projects that roll up years of history.
How it Works
-
Select an Event: Use the dropdown to choose a specific event. Once selected, all KPIs, AI insights, and modules automatically change over to display data for that event.
-
Access Event Projects: Instead of looking at a single year, you can select an event project to see data aggregated across multiple years. This is particularly helpful for pre-event planning, benchmarking, and long-term strategy development.
-
Stay in Context: No matter where you are in Bear IQ, the toggle ensures that what you’re viewing always reflects the event (or project) you’ve chosen.
-
Personalized to Your Role: Whether you’re focused on one upcoming event or need to compare a full portfolio, the toggle adapts to the way your organization works.
View Automated Insights
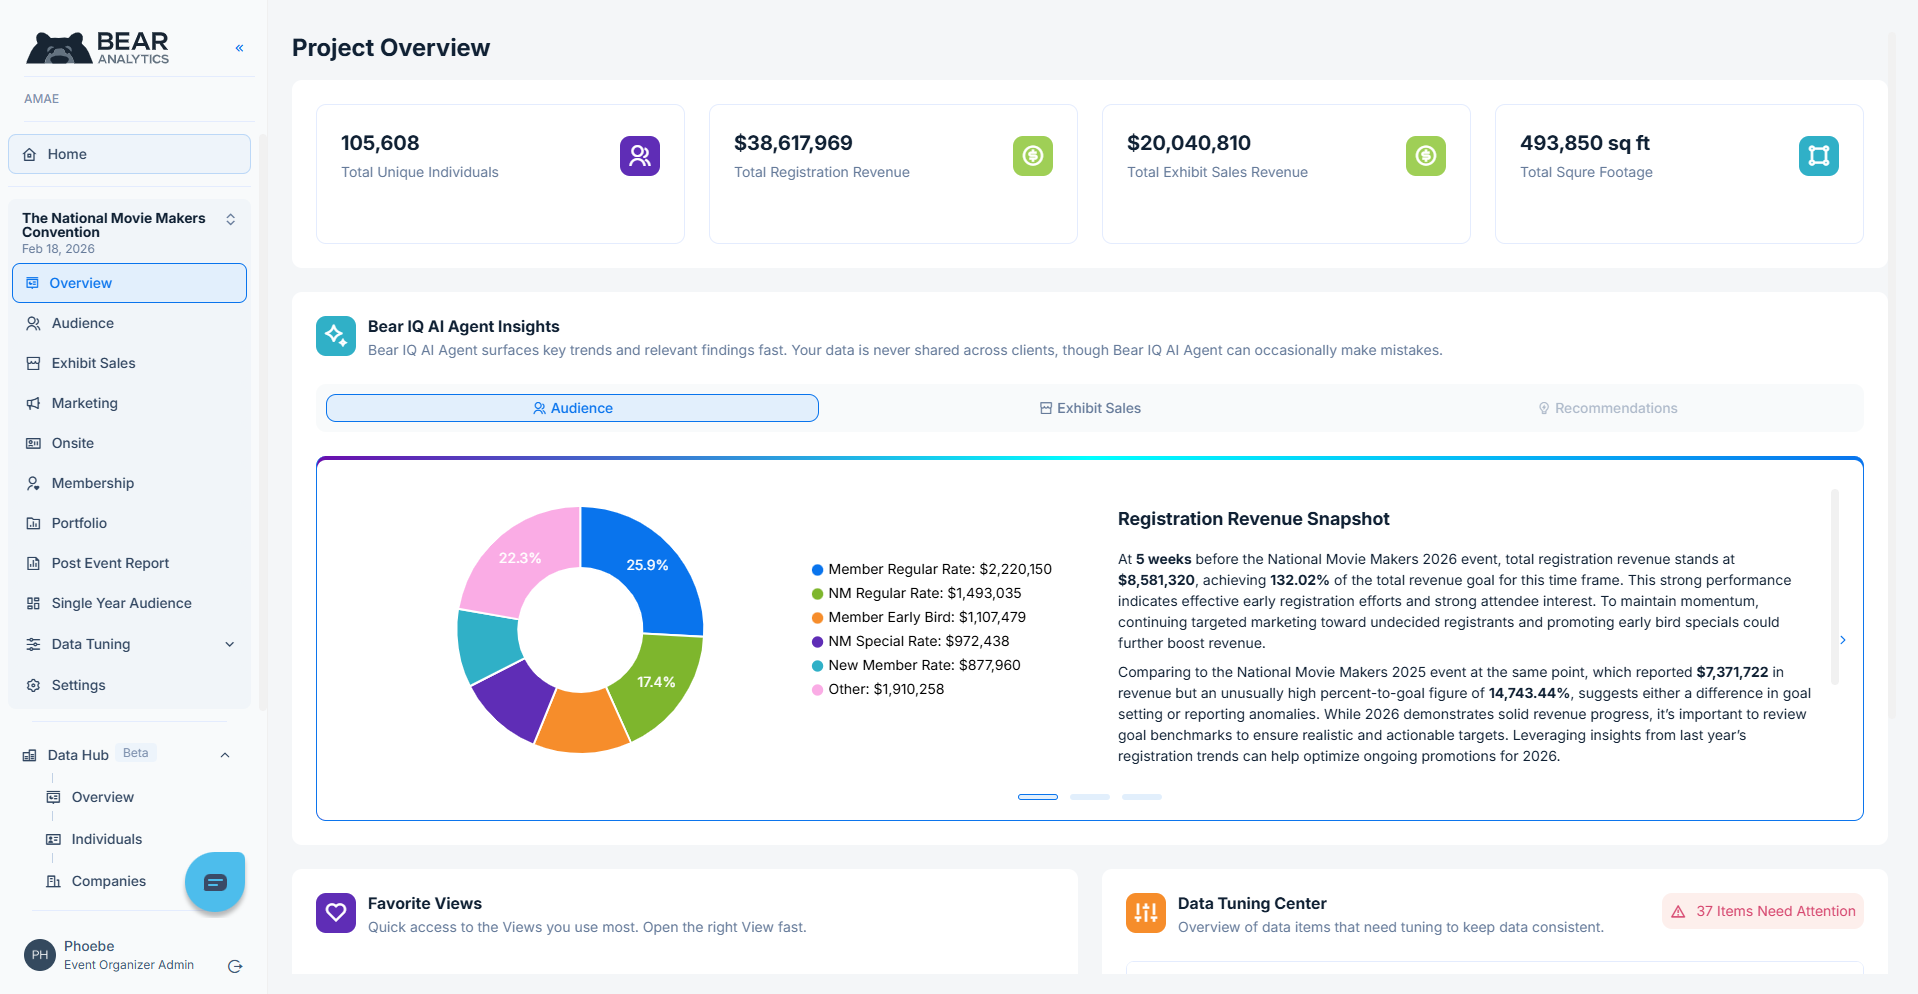
The overview dashboard gives you a high-level snapshot of your event data. You can view insights like total unique individuals, total registration or exhibit sales revenue. Think of it as your executive summary. If you just need a quick pulse check on how things are tracking, this is where you start
Configure Settings Menu
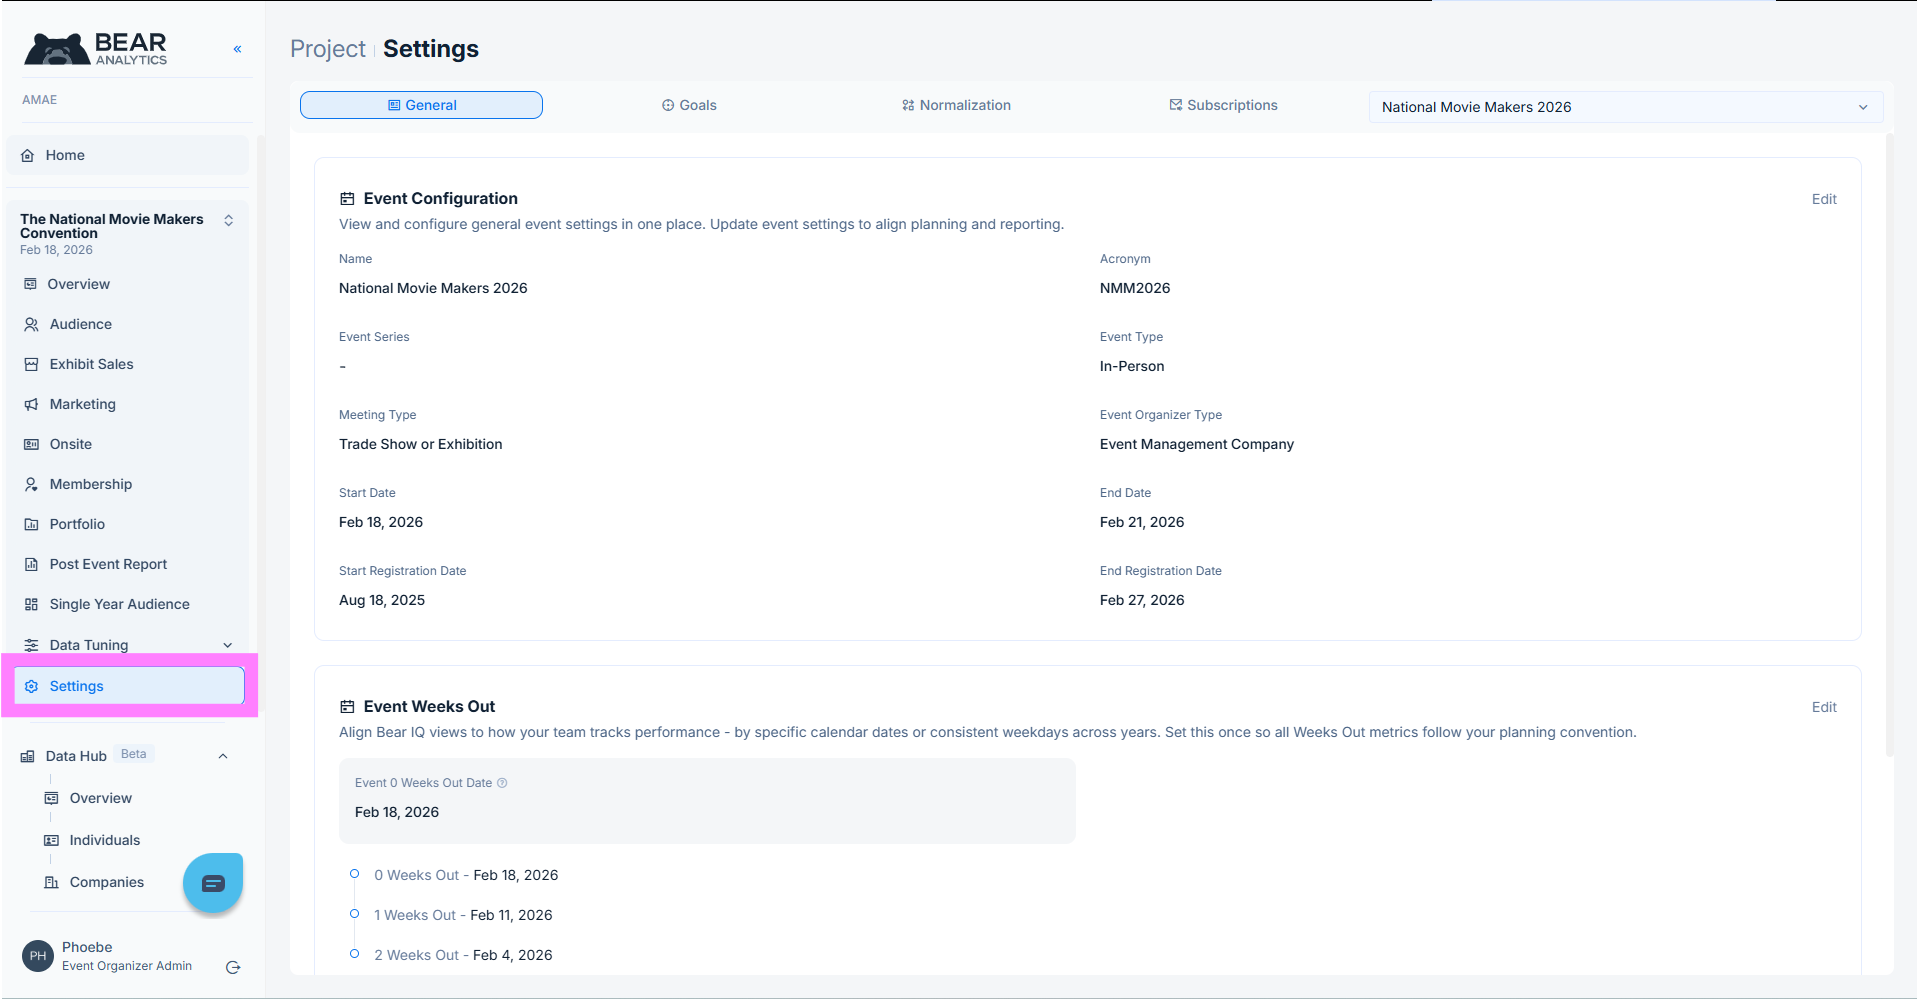
Now let's head down to settings in the left-hand menu. This is where you go to configure your Bear IQ environment. Whether you need to adjust event level configurations, manage weeks out or edit event registration dates, this is where you do it.
Manage Users and Reports
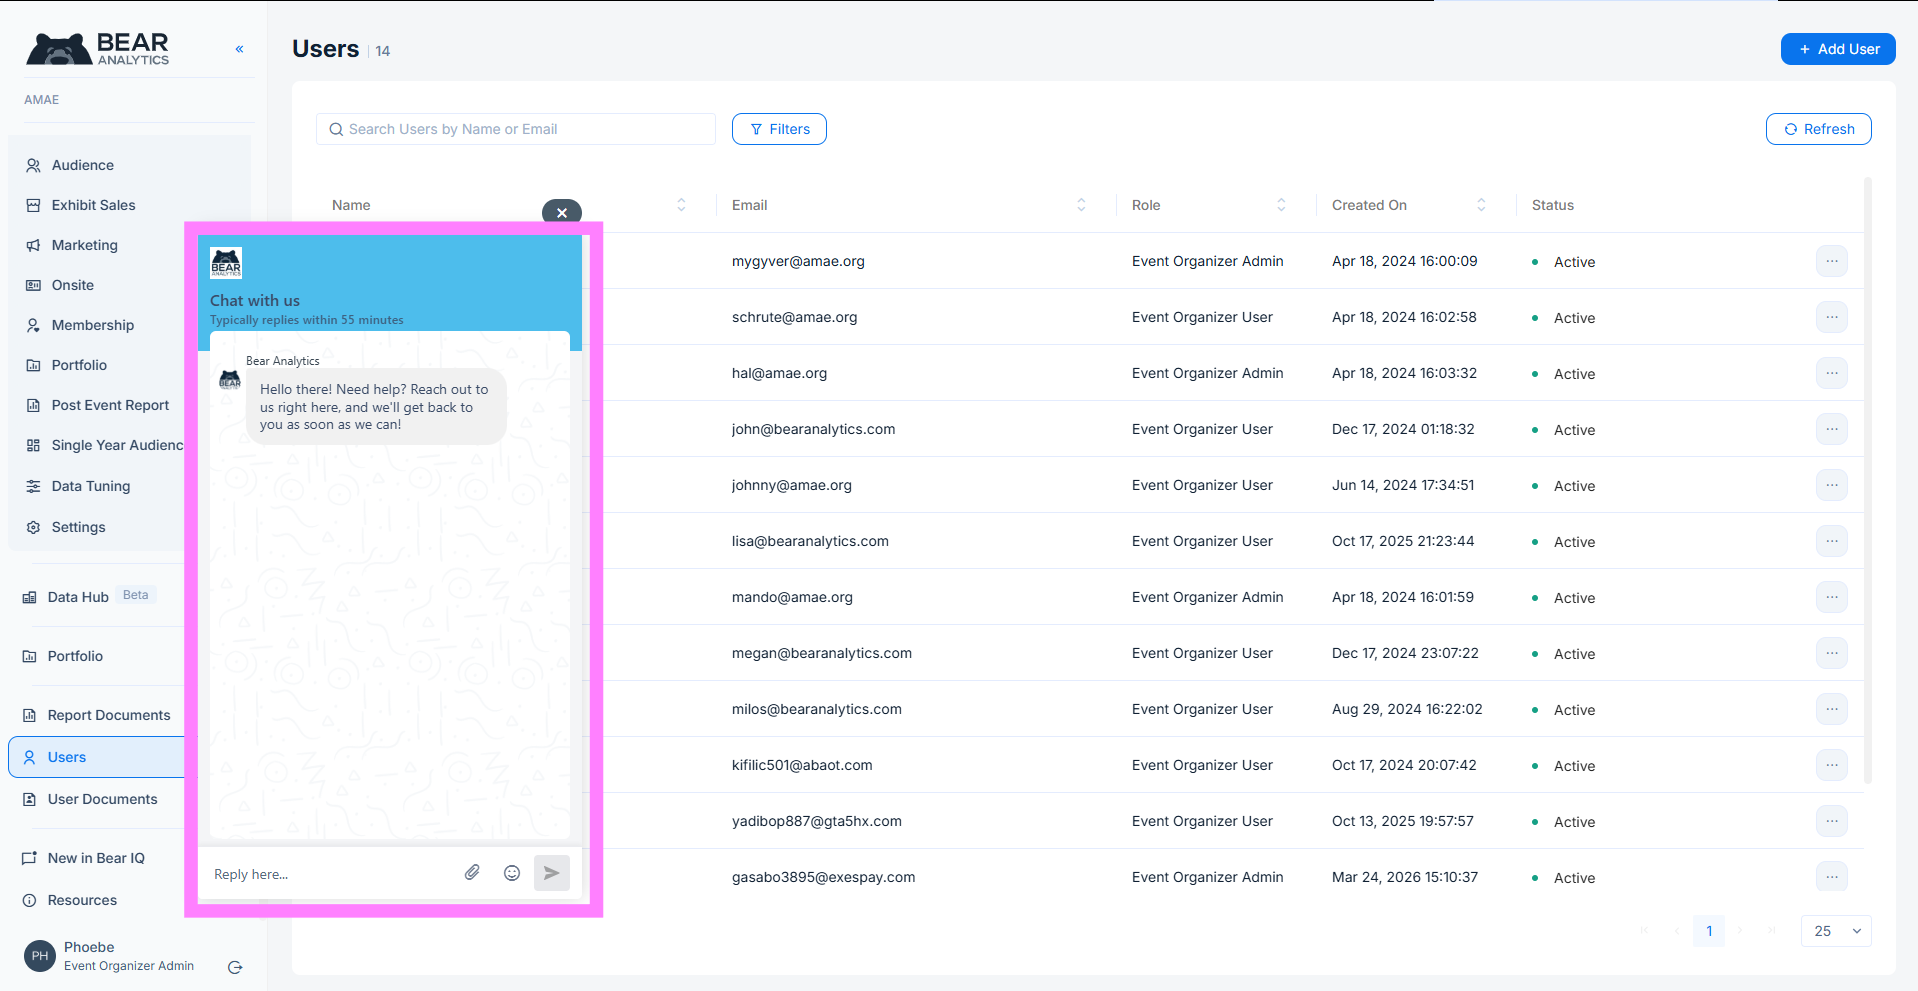
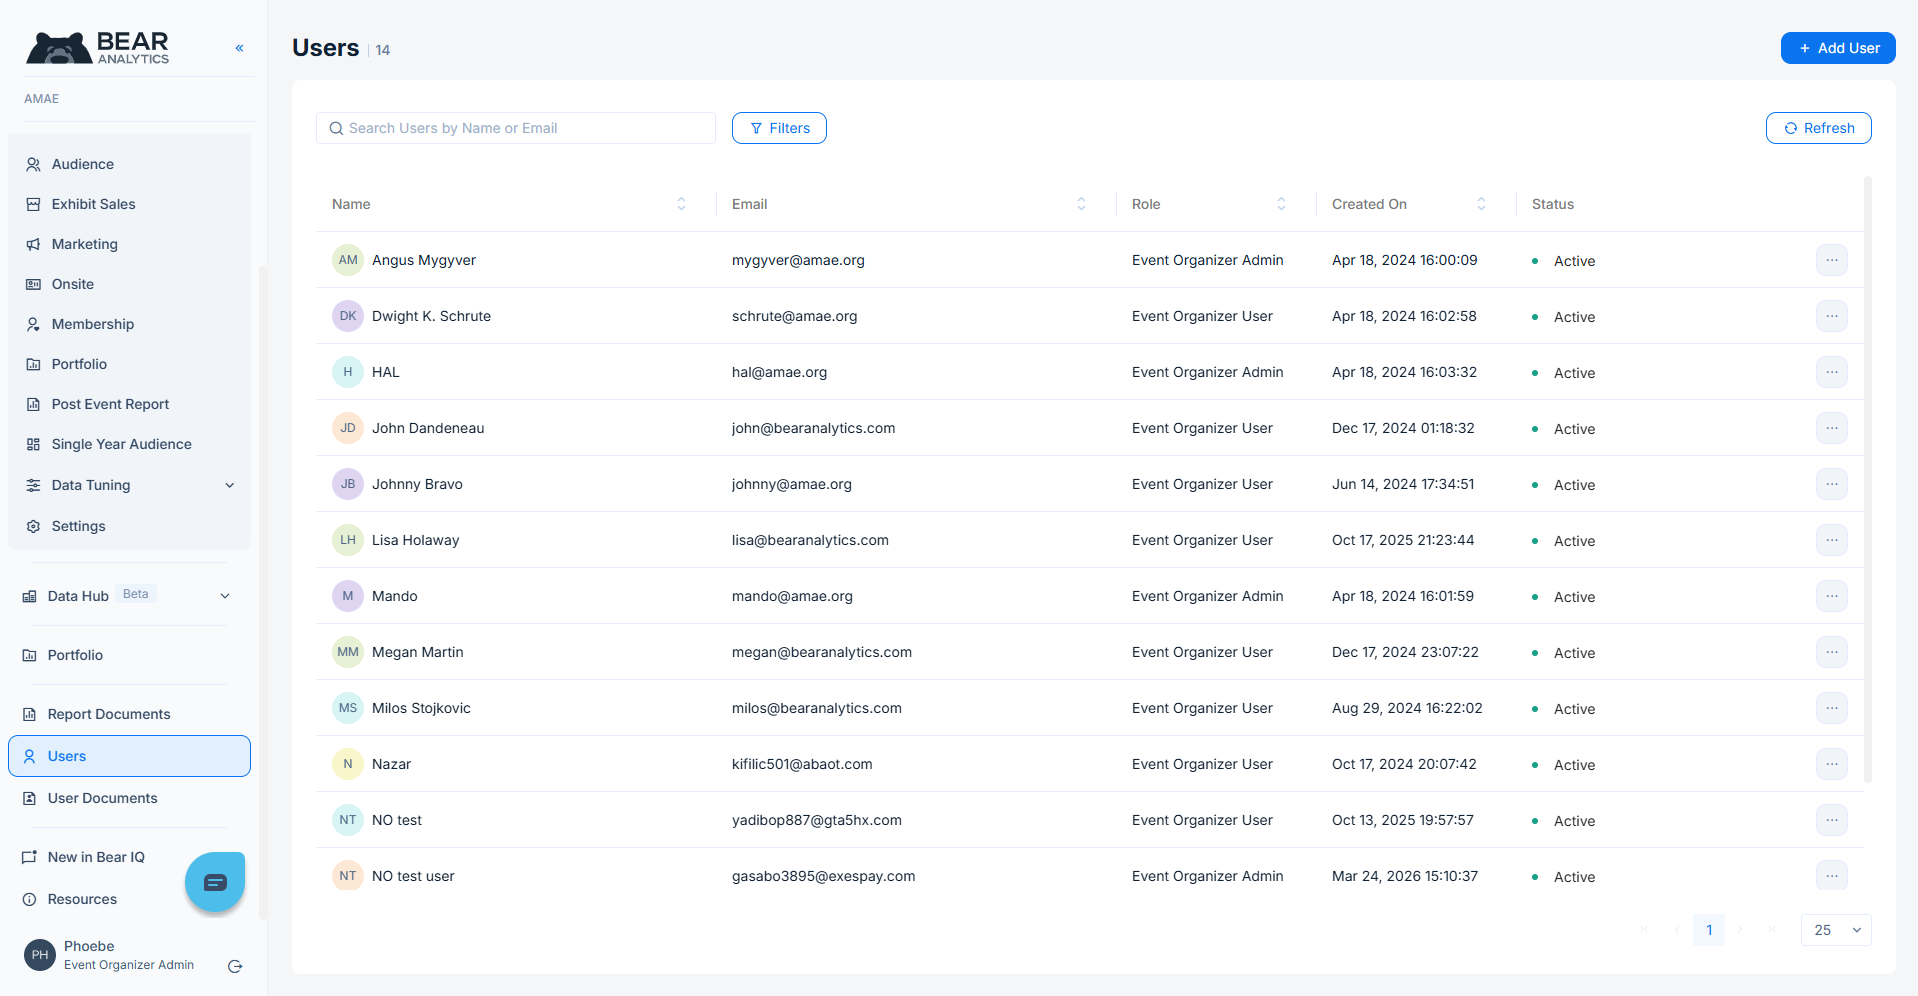
Scrolling down further, you'll see options to manage users and documents. The Users section allows you to see who has access to your Bear IQ modules, what permission level they have, and manage their user access. This is where you would add a new team member or update someone's access.
Use Integrated Support Chat
Finally, a built-in chat support tool is available to you in the bottom left corner. If you have any questions, you can click that icon and reach the Bear Analytics support team directly without leaving your dashboard. There's no need to open a separate email or find a phone number. Support is built right into your platform.