Audience Overview Pane Guide
The Audience Overview Pane in Bear IQ serves as a dynamic tool to provide a real-time snapshot of your event's registration performance. This guide explains its features, allowing event planners, marketers, and analysts to track current event statistics and compare them with past performances. Utilize sortable columns, expandable data views, and the Aggregate function to enhance your event analysis and strategy.
Tip: Use the Aggregate view to easily compare performance across different events, offering a clearer picture of trends over time.
Key Moments to look out for:
Utilizing sortable columns for organized data presentation.
Expanding tables for in-depth data analysis.
Heads up: Hover over charts and graphs to access pertinent tooltips, providing valuable insights at your fingertips.
Exploring Features
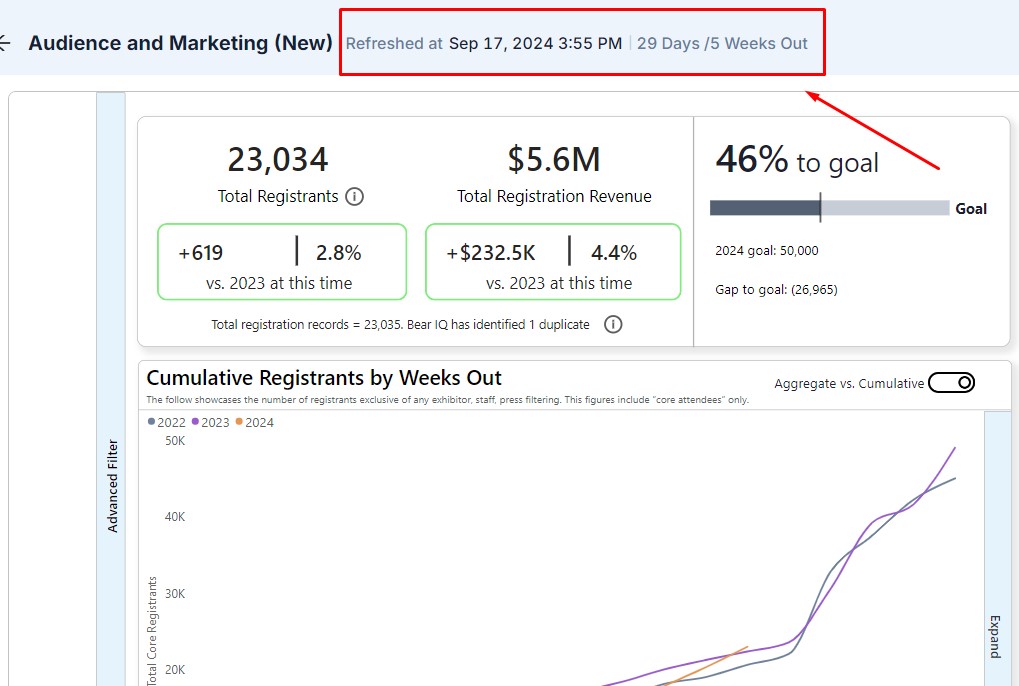
Data Refresh Status
Check the last refresh time in the top left corner to ensure you're working with the most recent data.

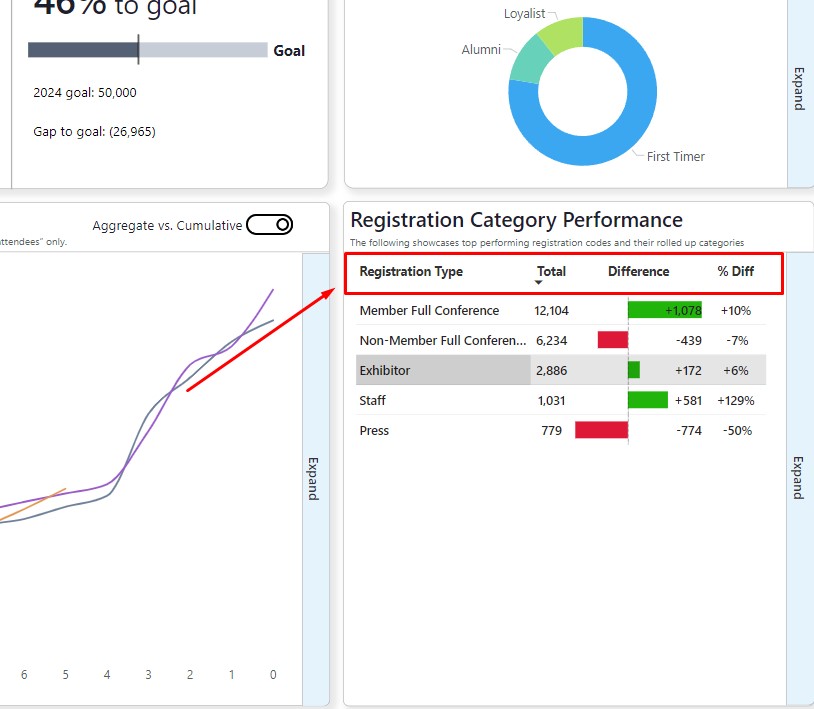
Sortable Tables
Click on any column header to reorganize your tables, allowing you to prioritize specific metrics aligned with your analysis needs.

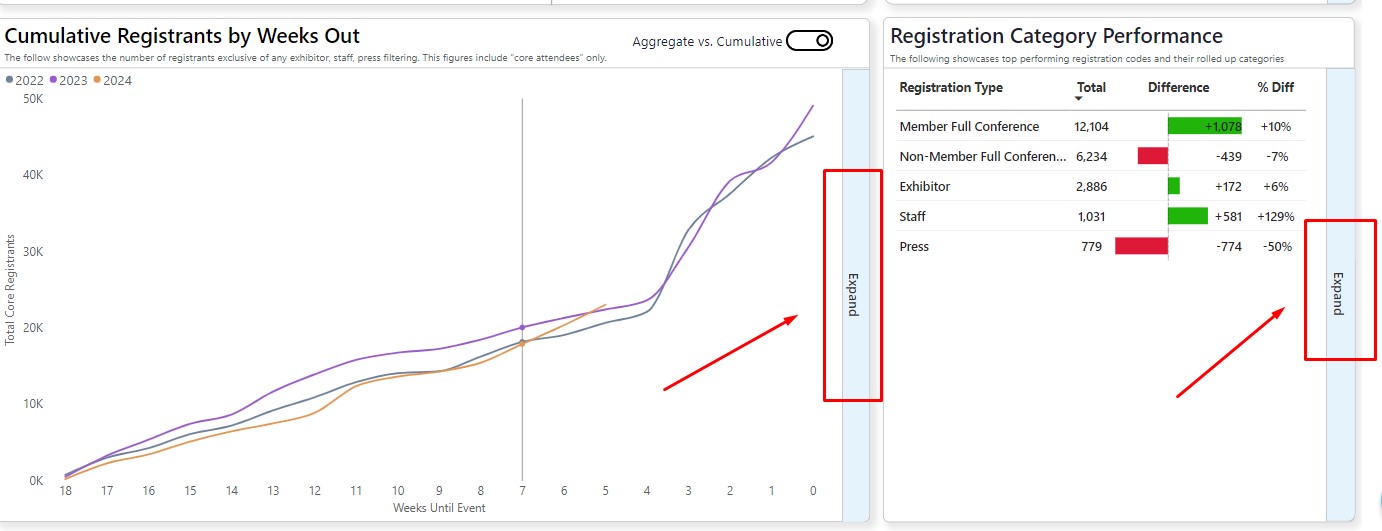
Expandable Data Views
Use the Expand button to access detailed metrics and gain in-depth insights into your registration data.

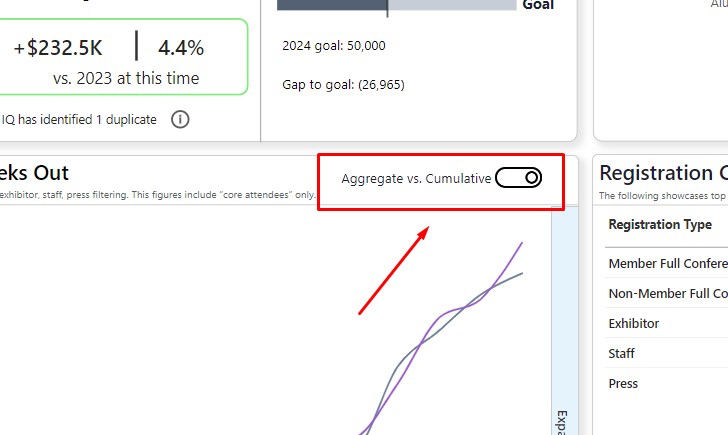
Aggregate View Analysis
Toggle to Aggregate view for comprehensive week-over-week event performance analysis, helping you identify trends and make informed decision

Leveraging the Audience Overview Pane in Bear IQ provides a comprehensive understanding of your event's registration trends. By efficiently utilizing its features, such as sortable tables, expandable views, and the historical Aggregate analysis, you can optimize your event strategies for maximum success.
